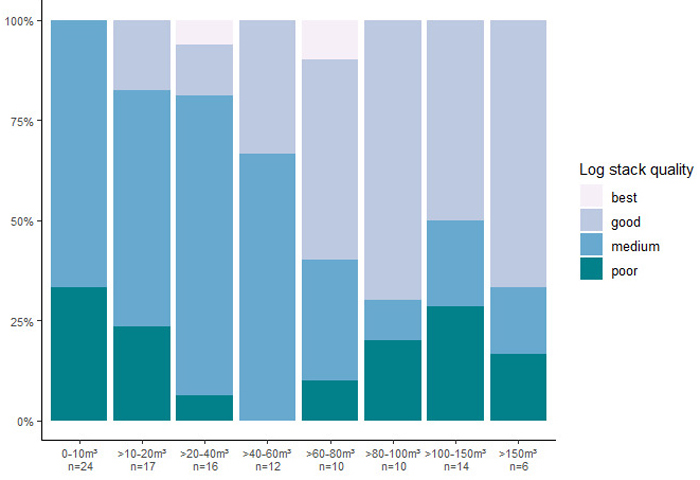
Fig. 1. Categorization of the analyzed hardwood log stacks into best, good, medium and poor quality for different log stack gross volume size classes.
| Table 1. Section length (LS) depending on log stack length (LAB) for section-wise log stack gross volume estimation, adapted from (DFWR and DHWR 2020). | |
| Log stack length (LAB) | Section length (LS) |
| 0–10 m | 1 m |
| >10–20 m | 2 m |
| >20–40 m | 4 m |
| >40–60 m | 6 m |
| >60–80 m | 7 m |
| >80–100 m | 8 m |
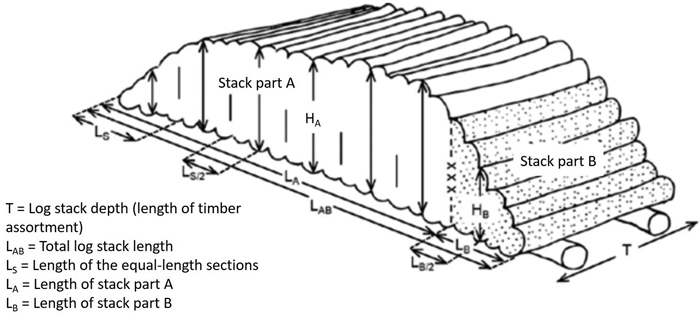
Fig. 2. Required measurement parameters and measurement locations for calculating stacked timber in cubic meter according to the German framework agreement for timber trade, adapted from (DFWR and DHWR 2020).
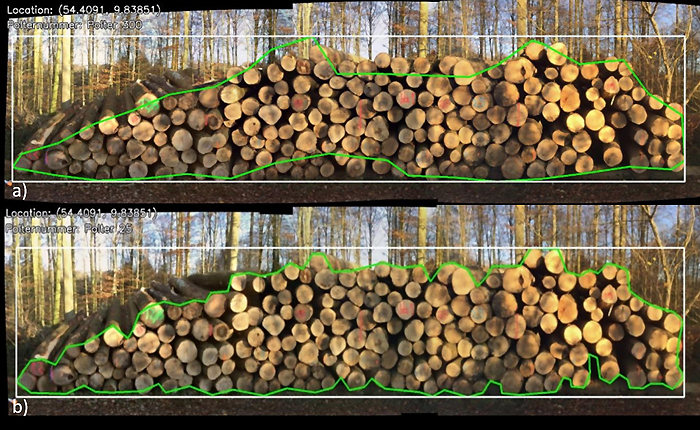
Fig. 3. Contour of the log stack as a) automatically defined by the app and b) with manual post-processing after image capturing with a photo-optical measurement application in order to determine log stack volume.
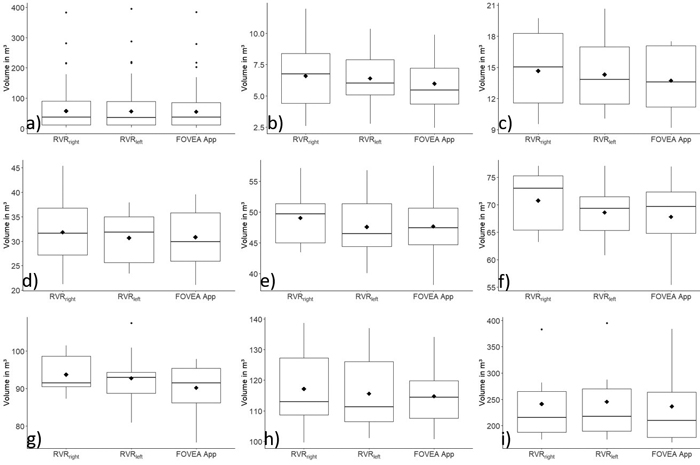
Fig. 4. Boxplots showing the mean (diamond) and median (continuous horizontal line) of the log stack gross volume (in m3) using RVRright, RVRleft and App for a) all log stacks (n = 109), b) 0–10 m3 (n = 24), c) >10–20 m3 (n = 17), d) >20–40 m3 (n = 16), e) >40–60 m3 (n = 12), f) >60–80 m3 (n = 10), g) >80–100 m3 (n = 10), h) >100–150 m3 (n = 14) and i) >150 m3 (n = 6). View larger in new window/tab.
| Table 2. Mean deviation between the different log stack gross volume estimations. | |||
| Mean deviation (±SD) between/ Gross volume of log stack | RVRleft and RVRright in % | RVRleft and App in % | RVRright and App in % |
| 0–10 m3 (n = 24) | 3.24 ± 30.21 | –4.89 ± 21.05 | –4.92 ± 17.43 |
| >10–20 m3 (n = 17) | 2.69 ± 11.90 | –3.16 ± 11.44 | –5.21 ± 10.55 |
| >20–40 m3 (n = 16) | 3.39 ± 8.52 | 0.30 ± 7.74 | –2.76 ± 6.47 |
| >40–60 m3 (n = 12) | 3.54 ± 8.77 | 0.53 ± 9.05 | –2.78 ± 6.06 |
| >60–80 m3 (n = 10) | 3.40 ± 7.70 | –1.26 ± 5.97 | –4.00 ± 9.11 |
| >80–100 m3 (n = 10) | 1.28 ± 5.25 | –2.58 ± 6.16 | –3.70 ± 6.12 |
| >100–150 m3 (n = 14) | 1.29 ± 3.11 | –0.49 ± 4.85 | –1.70 ± 5.28 |
| >150 m3 (n = 6) | –1.38 ± 2.65 | –3.70 ± 2.99 | –2.33 ± 2.75 |
| All log stacks (n = 109) | 2.54 ± 15.61 | –2.09 ± 12.00 | –3.66 ± 10.30 |
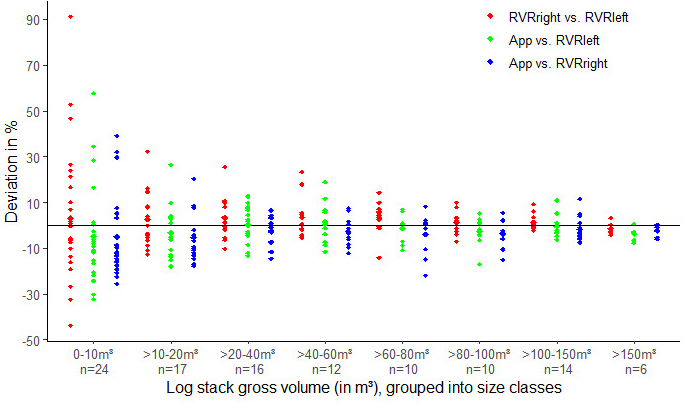
Fig. 5. Deviation (in %) of log stack gross volume estimations for different log stack size classes. In red, the deviation between RVRright and RVRleft; in green, between App and RVRleft; and in blue, between App and RVRright.
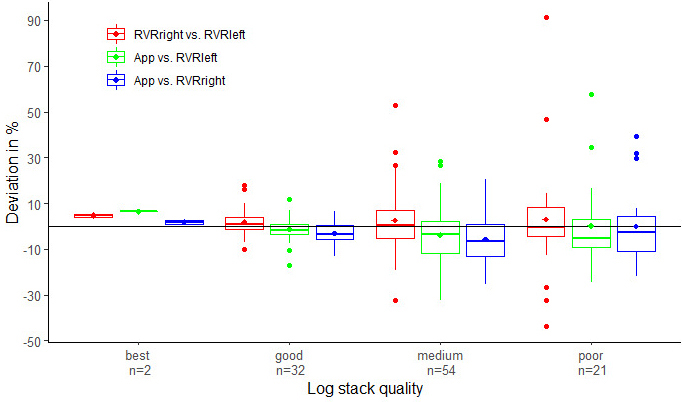
Fig. 6. Boxplot of the deviation of log stack gross volume estimations (in %) for different log stack qualities. In red, the deviation between RVRright and RVRleft; in green, between App and RVRleft; and in blue, between App and RVRright.