| Table 1. Norway spruce seed lots (stand seed) used in the study, their origin and germination percentages under laboratory conditions. | ||||||
| Seedlot | Year of maturation | Municipality | Co-ordinates | 1000 seed weight (g) | Germination, % (±SE) | |
| Day 7 | Day 14 | |||||
| A T03-06-0414 | 2006 | Suonenjoki | 62°27´N - 62°51´N, 26°50´E - 27°32´E | 6.0 | 22 (± 2.4) | 97 (± 0.6) |
| B T03-06-0421 | 2006 | Maaninka and Siilinjärvi | 62°57´N - 63°20´N, 26°57´E - 27°57´E | 5.8 | 20 (± 2.1) | 99 (± 0.5) |
| Table 2. Percentage of different quality seeds according to radiography (n = 384) and the water content of the un-soaked control and bottom fraction seeds after a 15h soaking and surface drying. The class “immature” includes anatomically immature, but viable seeds. Seeds with mechanical or undetermined damage were classified as “other”. | |||||||
| Seed lot | Treatment | Full | Larva | Immature | Empty | Other | Water content (± SD) |
| A | Control | 96.1 | 0.5 | 3.1 | 0 | 0.3 | 5.0 (± 0.1) |
| A | Bottom fraction | 100 | 0 | 0 | 0 | 0 | 17.4 (± 0.2) |
| A | Surface fraction | 74.7 | 13.3 | 8.3 | 0.8 | 2.9 | not measured |
| B | Control | 97.9 | 0.5 | 1.6 | 0 | 0 | 5.26 (± 0.1) |
| B | Bottom fraction | 100 | 0 | 0 | 0 | 0 | 17.8 (± 0.4) |
| B | Surface fraction | 86.7 | 1.8 | 10.7 | 0.5 | 0.3 | not measured |
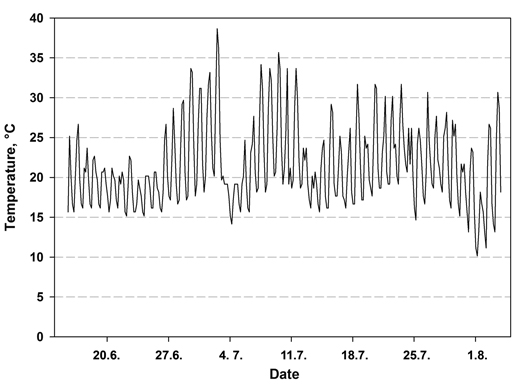
Fig. 1. Air temperature at the seedling level during the first 49 days after sowing in a nursery greenhouse measured at 1h interval.
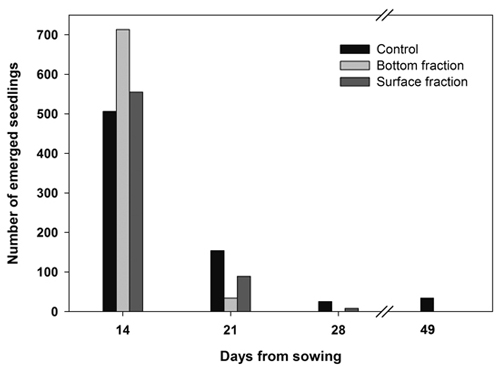
Fig. 2. Number of new emerged seedlings on each day of observation. Containerized Norway spruce seedlings originating from soaked (bottom and surface fraction) and control seeds sown on June 14.
| Table 3. Percentage of emerged Norway spruce seedlings 49 days after sowing in peat-filled containers and the mean time of emergence. The emergence percentage is calculated in relation to both all seeds sown (n = 64) and on the based on viable seed (full and anatomically immature) according to radiography (n = viable). | |||
| Emergence percentage (± SE) | Mean time of emergence, days (± SE) | ||
| n = 64 | n = viable | ||
| Seed lot A | |||
| Control | 92.4 (± 1.7) | 94.2 (± 1.4) | 16.9 (± 0.4) |
| Bottom fraction | 97.7 (± 0.8) | 97.4 (± 0.8) | 14.3 (± 0.1) |
| Surface fraction | 79.1 (± 3.3) | 94.0 (± 1.5) | 15.4 (± 0.2) |
| Seed lot B | |||
| Control | 95.2 (± 1.3) | 94.7 (± 1.3) | 18.0 (± 0.5) |
| Bottom fraction | 97.2 (± 0.9) | 97.6 (± 0.7) | 14.4 (± 0.1) |
| Surface fraction | 91.4 (± 1.9) | 94.5 (± 1.3) | 15.1 (± 0.2) |
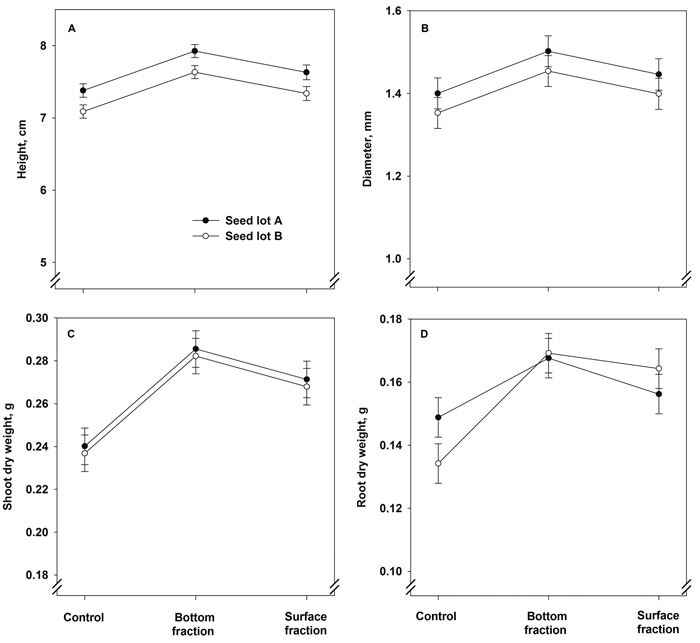
Fig. 3. Model predictions for height, stem diameter, and shoot and root dry mass (± SE) of containerized 1.5-year-old Norway spruce seedlings at the end of the first growing season. The seedlings were grown in the first year from June onwards.
| Table 4. Tests for fixed effects for measurements of 1.5-year-old containerized Norway spruce seedlings after the first growing season according to linear mixed models. The seedlings were grown in the first year from June onwards. A block was set as a random term (test not shown). Denominator degrees of freedom for approximate F-tests are calculated using algebraic derivatives. | ||||||
| Response variate | Fixed model term | Wald statistic | df nominator | F statistic | df denominator | p |
| Height, 1st year | Treatment | 24.56 | 2 | 12.32 | 1343.3 | <0.001 |
| Seed lot | 9.07 | 1 | 9.07 | 1356.3 | 0.003 | |
| Treatment × seed lot | 2.52 | 2 | 1.26 | 1352.4 | 0.284 | |
| Diameter, 1st year | Treatment | 38.23 | 2 | 19.12 | 1229.9 | <0.001 |
| Seed lot | 11.62 | 1 | 11.62 | 1208.6 | <0.001 | |
| Treatment × seed lot | 0.14 | 2 | 0.07 | 1203.5 | 0.930 | |
| Shoot, 1st year | Treatment | 30.37 | 2 | 15.18 | 678.6 | <0.001 |
| Seed lot | 0.23 | 1 | 0.23 | 658.0 | 0.632 | |
| Treatment × seed lot | 5.10 | 2 | 2.55 | 650.4 | 0.079 | |
| Root, 1st year | Treatment | 31.88 | 2 | 15.94 | 678.7 | <0.001 |
| Seed lot | 0.17 | 1 | 0.17 | 658.5 | 0.683 | |
| Treatment × seed lot | 5.70 | 2 | 2.85 | 651.1 | 0.058 | |
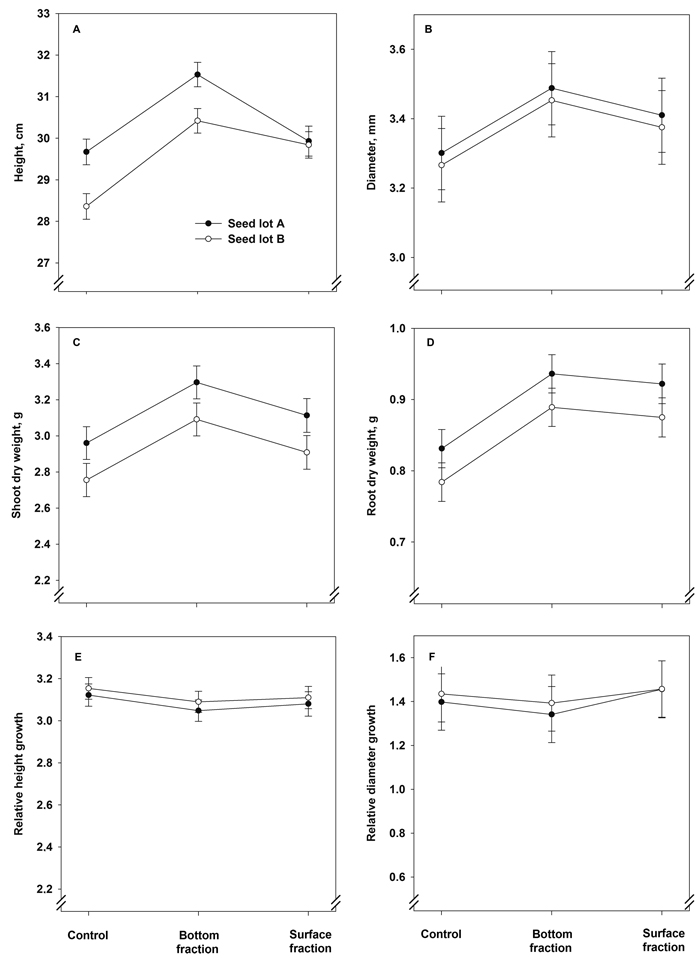
Fig. 4. Model predictions for height, stem diameter, shoot and root dry mass and relative height and stem diameter growth (± SE) of containerized 1.5-year-old Norway spruce seedlings at the end of the second, final growing season.
| Table 5. Tests for fixed effects for measurements of 1.5-year-old containerized Norway spruce seedlings after the second, final growing season according to linear mixed models. A block was set as a random term (test not shown). Denominator degrees of freedom for approximate F-tests are calculated, using algebraic derivatives. | ||||||
| Response variate | Fixed model term | Wald statistic | n.d.f. | F statistic | d.d.f. | F pr |
| Height, 2nd year | Treatment | 96985.46 | 2 | 48492.73 | 1383.0 | <0.001 |
| Seed lot | 27131.88 | 1 | 27131.88 | 1383.0 | <0.001 | |
| Treatment × seed lot | 9808.60 | 2 | 4904.30 | 1383.0 | <0.001 | |
| Diameter, 2nd year | Treatment | 21.62 | 2 | 10.81 | 1342.6 | <0.001 |
| Seed lot | 1.06 | 1 | 1.06 | 1341.6 | 0.304 | |
| Treatment × seed lot | 0.87 | 2 | 0.44 | 1340.7 | 0.647 | |
| Shoot dry mass, 2nd year | Treatment | 11.31 | 2 | 5.65 | 654.8 | 0.004 |
| Seed lot | 6.24 | 1 | 6.24 | 656.7 | 0.013 | |
| Treatment × seed lot | 0.37 | 2 | 0.18 | 655.6 | 0.833 | |
| Root dry mass, 2nd year | Treatment | 13.86 | 2 | 6.93 | 654.7 | 0.001 |
| Seed lot | 3.57 | 1 | 3.57 | 656.6 | 0.059 | |
| Treatment × seed lot | 0.47 | 2 | 0.24 | 655.2 | 0.789 | |
| Relative height growth | Treatment | 2.41 | 2 | 1.20 | 1224.4 | 0.300 |
| Seed lot | 0.87 | 1 | 0.87 | 1203.2 | 0.352 | |
| Treatment × seed lot | 0.02 | 2 | 0.01 | 1195.9 | 0.990 | |
| Relative diameter growth | Treatment | 5.46 | 2 | 2.73 | 1205.6 | 0.066 |
| Seed lot | 1.04 | 1 | 1.04 | 1182.7 | 0.308 | |
| Treatment × seed lot | 0.43 | 2 | 0.22 | 1177.0 | 0.806 | |