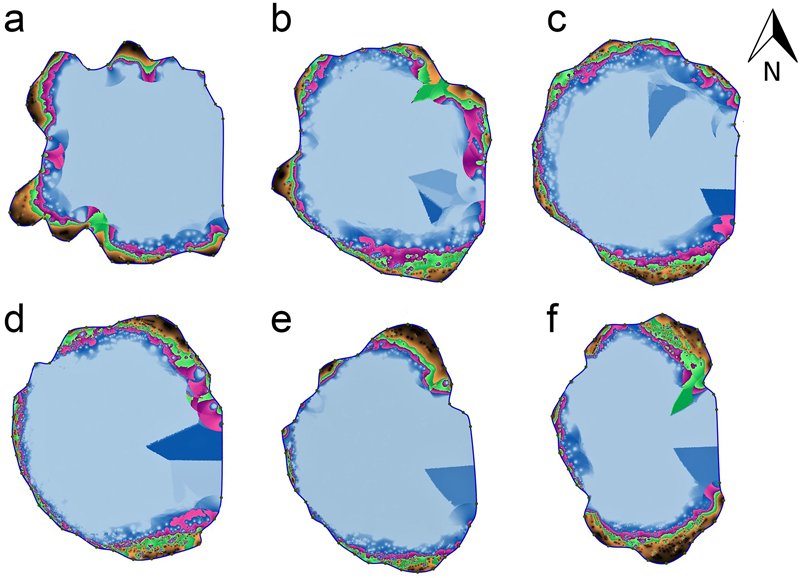
Fig. 1. Tomograms of the stem cross-sections at six heights above the ground: 25 (a), 75 (b), 125 (c), 175 (d) 225 (e) and 275 (f) cm of the ‘Bartek’ oak tree in Poland. Areas marked in black and brown indicate layers of undamaged wood and the green indicates slightly damaged wood; purple, pink, blue and white are areas with the weakest wood structure or where the trunk cavity is sealed with fir wood preserved with synthetic resin.
| Table 1. The results of sonic tomograph measurements of wood on trunk cross-sections at six heights above the ground at the ‘Bartek’ oak tree in Poland. | ||
| Height above ground level [cm] | Thickness of layer of undamaged wood min–max [cm] | Share of undamaged wood [per cent] |
| 25 | 4.2–36.3 | 9 |
| 75 | 3.5–29.9 | 7 |
| 125 | 2.2–19.7 | 5 |
| 175 | 3.3–23.0 | 5 |
| 225 | 2.4–33.5 | 6 |
| 275 | 3.2–38.2 | 11 |
| Table 2. Chlorophyll a fluorescence parameters (Fo,, Fm, Fv/Fm, non-photochemical fluorescence quenching parameters (qN, NPQ), gas exchange parameters (A, E, WUE), stomatal conductivity [Gs] ) and water potential [Ψ] measured on leaves from two branches of ‘Bartek’ oak tree in Poland. Averages of 5 leaves, ±SD. | ||
| Branch | ||
| 1 | 2 | |
| Chlorophyll a fluorescence parameters | ||
| Fo | 145.4 ± 7.8 | 141.6 ± 7.7 |
| Fm | 705.8 ± 123.5 | 579.4 ± 93.4 |
| Fv/Fm | 0.79 ± 0.03 | 0.75 ± 0.03 |
| qN | 0.68 ± 0.03 | 0.70 ± 0.15 |
| NPQ | 2.14 ± 0.34 | 1.98 ± 0.50 |
| Gas exchange parameters | ||
| A [µmol CO2 m–2 s–1] | 16.9 ± 1.8 | 18.5 ± 2.1 |
| E [mmol H2O m–2 s–1] | 6.1 ± 0.6 | 7.3 ± 0.8 |
| WUE [A/E] | 2.8 | 2.5 |
| Stomatal conductivity | ||
| Gs [mol H2O m –2 s–1] | 0.15 ± 0.02 | 0.16 ± 0.02 |
| Leaf water potential | ||
| Ψ [–MPa] | –1.4 ± 0.3 | –1.1 ± 0.2 |
| [Fo], initial fluorescence, [Fm], maximal fluorescence, [Fv/Fm] = (Fm – Fo)/ Fm, qN = 1 − Fm × Fo/(Fm − Fo)2 × (1 − ΦD)2/ΦD, where [ΦD] quantum rate of absorbed light energy in PSII allocated to ‘Dissipation’ in the Demmig-Adams model; NPQ = (Fm − Fo)/Fo × ΦD/(1 − ΦD) – 1 ]; [A] assimilation; [E] transpiration [E]; [WUE] water use efficiency; [Ψ] leaf water potential. | ||
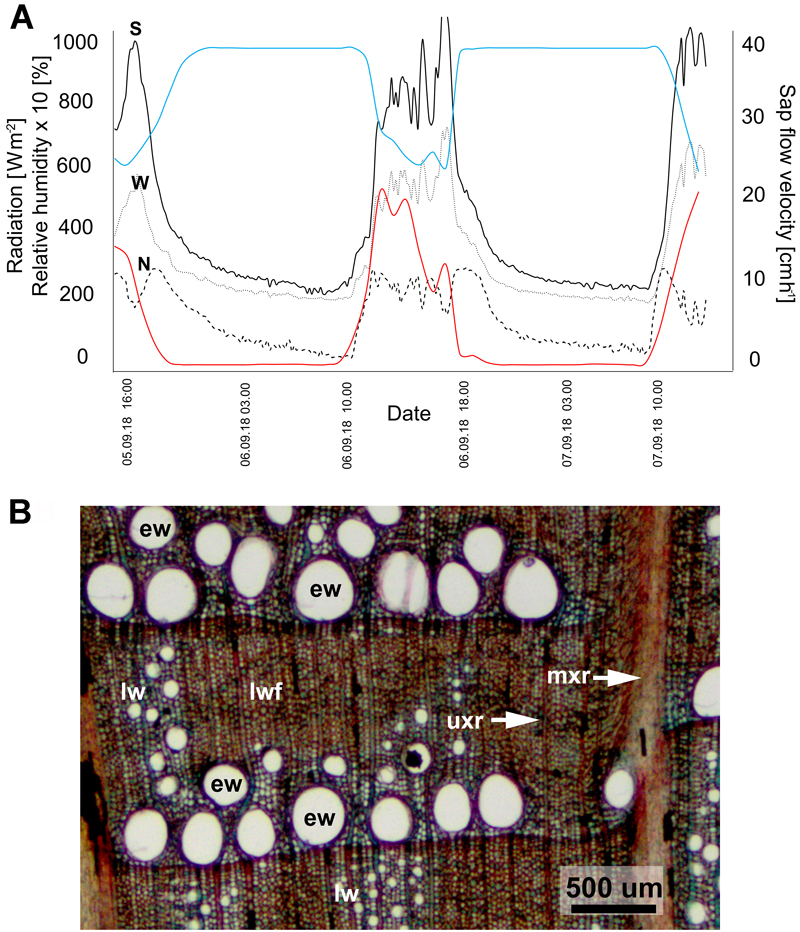
Fig. 2. Xylem sap flow (A) and wood anatomy (B) in the trunk of ‘Bartek’ oak tree in Poland. A: Dynamics of xylem sap flow velocity (black lines) on three sides (S – southern, N – northern, W – western) of the trunk of in comparison with solar radiation (red lines) and relative humidity (blue lines). Measurements were made from September 5, 2018 at 15:00 to September 7, 2018 at 12:00. B: Transverse section through the outermost annual rings of wood from the base of the tree. Earlywood with large diameter vessels (ew) form a layer aligned to the annual ring boundary. The radial arrangement of small diameter latewood vessels (lw) in the layer of latewood fibers (lwf) in wider rings is visible. Unilateral (uxr) and multilateral xylem rays (mxr) are present.