| Table 1. Examples of sustainability attributes in the existing literature. | |
| Sustainability attributes | Examples and sources |
| Environmental sustainability attributes | Preserving natural ecosystems and biodiversity, and management of production processes to reduce amount of waste, usage of energy, and carbon dioxide emissions (Lähtinen et al. 2016a; Bangsa and Schlegelmilch 2020). |
| Social sustainability attributes | Health, welfare, and social justice issues connected to impacts on workers and suppliers, consumers, and communities at different phases of value chains (i.e., raw material extraction, primary and secondary production, and use of final product) (Elkington 1997; Lähtinen et al. 2016b; Catlin et al. 2017). |
| Economic sustainability attributes | Financial performance (e.g., cost reductions and value creation), and “economic interests of external stakeholders (e.g., improvements in economic well-being and standard of living)” (Sheth et al. 2011; Lähtinen et al. 2016b). |

Fig. 1. Analytical framework of the study to assess consumer perceptions of wooden interior product quality as a combination of quality cues and attributes and their connections with consumers’ sociodemographic background (mod. from the Model of the Quality Perception Process of Steenkamp 1989). View larger in new window/tab.
| Table 2. Peer-reviewed journal articles used to operationalize the quality indicators of wooden interior products in the questionnaire. | ||
| Quality indicators | Wood product quality studies | Other wood product studies indirectly connected with quality |
| Wood species used in the product, e.g., oak, birch | -- | Donovan et al. 2004; Nicholls et al. 2004; Brinberg et al. 2007; Bumgardner et al. 2007; Nicholls and Bumgardner 2007; Scholz and Decker 2007; Arowosoge and Tee 2010 |
| Product is made of solid wood, e.g., furniture made of solid wood | -- | Jonsson et al. 2008; Lindberg et al. 2013 |
| Visual properties, e.g., surface patterns | Aesthetics (Sinclair et al. 1993); overall lumber appearance, lumber straightness (Hansen and Bush 1996, 1999); aesthetics (Costa et al. 2011); appearance/visuality (Toivonen 2012) | Knots (Broman et al. 2001); character marks (Bumgardner et al. 2009); grain (Arowosoge and Tee 2010); aesthetic attributes (Scholz and Decker 2007); aesthetics (Hakala et al. 2015) |
| Tactile properties, e.g., surface | -- | Smoothness, hardness (Jonsson et al. 2008); smoothness, roughness, solidness (Lindberg et al. 2013); smoothness, roughness (Bhatta et al. 2017); smoothness (Ramanakoto et al. 2017) |
| Technical properties, e.g., solidity, hardness | Acoustics, structural integrity (Sinclair et al. 1993); stiffness/strength of lumber (Hansen and Bush 1996, 1999); global quality, thermal insulation, acoustic insulation (Costa et al. 2011); technical quality (Toivonen 2012) | Hardness (Jonsson et al. 2008); solidness (Lindberg et al. 2013) |
| Longevity, e.g., resistance against moisture and decay | Absence of failure, service life, resistance to wear (Sinclair et al. 1993); durability of lumber, failure rate, long service life (Hansen and Bush 1996, 1999); product life (Costa et al. 2011) | Water sensitivity, warping, resistance against insects (Balázs 2010) |
| Information related to, e.g., product origin, production process and environmental impacts | Received information (Costa et al. 2011); availability of information about the producer, availability of product information (Toivonen 2012) | Product information (Donovan et al. 2004); label information (Hansmann et al. 2006); information on source of timber (Aguilar and Cai 2010); product information (Osburg et al. 2016a) |
| Product certificates, e.g., Swan Ecolabel, PEFC, FSC | -- | Bisgby and Ozanne 2002; Teisl et al. 2002; Jensen et al. 2003; Ozanne and Vlosky 2003; Anderson and Hansen 2004; O’Brien and Teisl 2004; Veisten and Solberg 2004; Hansmann et al. 2006; Aguilar and Cai 2010; Hakala et al. 2015; Paulin et al. 2018 |
| Price, e.g., the price of wood material vs. other materials | Sinclair et al. (1993), Costa et al. (2011) | Pakarinen and Asikainen 2001; Bigsby and Ozanne 2002; Teisl et al. 2002; Anderson and Hansen 2004; Bumgardner et al. 2007; Balázs 2010; Kuzman et al. 2012; Hakala et al. 2015; Knauf 2015 |
| Coziness, e.g., wood enhances hominess | -- | Rice et al. 2006; Nyrud and Bringslimark 2010; Hu et al. 2016 |
| Multifunctionality, e.g., wood has many applications | Multifunctionality of product (Sinclair et al. 1993); use properties (Toivonen 2012) | -- |
| Personal values, e.g., expressing one’s identity by using wood | Ability to enhance status of the user (Sinclair et al. 1993) | Ridoutt et al. 2002; Ridoutt et al. 2005 |
| Origin, e.g., the domesticity of wood | Domestic origin (Toivonen 2012) | Paulin et al. 2018 |
| Environmental aspects, e.g., environmental effects of wood | Environment (Costa et al. 2011); environmental friendliness (of the product) (Toivonen 2012) | Attributes of environmental impact (Pakarinen and Asikainen 2001); attributes of environmental impact (Donovan 2004); ecological aspects (Hakala et al. 2015) |
| Innovativeness, e.g., new ways to use wood in housing | -- | Osburg et al. 2016b |
| Retailer, e.g., the salesperson’s knowledge of wood | Supplier/salesperson characteristics (Hansen and Bush 1996; 1999); information conveyed by store advisors (Costa et al. 2011); service (related to the product), serviceability of the sales personnel (Toivonen 2012) | Place of purchasing (Arowosoge and Tee 2010); service, shopping experience (Ji et al. 2020) |
| Statements are measured on a five-point Likert scale (1 = not important at all –5 = very important) | ||
| Table 3. Sociodemographic background of the respondents on the survey to assess their opinions on the wooden interior product quality (n = 256) in comparison with the population in Finland aged 18–74 years in 2018 (in total 3 947 859) (StatiFin). | ||
| % respondents | % of people living in Finland | |
| Gender | ||
| Female | 51.6 | 49.8 |
| Male | 48.4 | 50.2 |
| Age | ||
| 18–34 years | 19.9 | 29.0 |
| 35–59 years | 38.3 | 44.2 |
| 60 years or older | 41.8 | 26.7 |
| Education | ||
| Basic education | 6.1 | N/A |
| General upper secondary education | 6.1 | N/A |
| Vocational upper secondary education | 35.9 | N/A |
| Higher education at university of applied sciences | 24.1 | N/A |
| Higher education at university, other academic education | 25.3 | N/A |
| Other | 2.5 | N/A |
| Municipality of residence* | ||
| Urban municipality | 72.5 | 72.7 |
| Semi-urban municipality | 15.3 | 14.9 |
| Rural municipality | 12.2 | 12.4 |
| Forest ownership (oneself or family member) | ||
| Yes | 33.7 | N/A |
| No | 66.3 | N/A |
| Forest sector involvement | ||
| Yes | 15.1 | N/A |
| No | 84.9 | N/A |
| * Classification based on Statistics Finland (https://www.stat.fi/meta/kas/til_kuntaryhmit_en.html). | ||
| Table 4. Variables on quality indicators of wooden interior products addressed in the questionnaire and the proportions of respondents with different views on their importance (n = 256). The least valued variables are underlined, and the most valued variables are bolded in the table. | ||||||
| Variable | Not important % | Not very important % | Neither important nor without importance % | Quite important % | Very important % | Mean |
| Wood species used in the product, e.g., oak, birch | 1.6 | 8.6 | 27.1 | 41.6 | 21.2 | 3.72 |
| Product is made of solid wood, e.g., furniture made of solid wood | 0.8 | 7.5 | 24.7 | 45.9 | 21.2 | 3.79 |
| Visual properties, e.g., surface patterns | -- | 5.5 | 22.0 | 50.2 | 22.4 | 3.89 |
| Tactile properties, e.g., surface | 0.4 | 3.6 | 20.6 | 54.9 | 20.6 | 3.92 |
| Technical properties, e.g., solidity, hardness | -- | 2.7 | 13.7 | 58.8 | 24.7 | 4.05 |
| Longevity, e.g., resistance against moisture and decay | 0.4 | 2.7 | 10.6 | 44.7 | 41.6 | 4.24 |
| Information related to, e.g., product origin, production process and environmental impacts | 0.8 | 11.4 | 29.5 | 41.3 | 16.9 | 3.62 |
| Product certificates, e.g., Swan Ecolabel, PEFC, FSC | 1.6 | 12.9 | 30.9 | 41.4 | 13.3 | 3.52 |
| Price, e.g., the price of wood material vs. other materials | 0.4 | 3.5 | 22.7 | 53.5 | 19.9 | 3.89 |
| Coziness, e.g., wood enhances hominess | -- | 1.2 | 8.6 | 51.2 | 39.1 | 4.28 |
| Multifunctionality, e.g., wood has many applications | 0.8 | 4.7 | 15.0 | 53.0 | 26.5 | 4.00 |
| Personal values, e.g., expressing one’s identity by using wood | 3.5 | 15.7 | 28.0 | 33.5 | 19.3 | 3.49 |
| Origin, e.g., the domesticity of wood | 0.4 | 7.0 | 19.1 | 43.8 | 29.7 | 3.95 |
| Environmental aspects, e.g., environmental effects of wood | 1.6 | 5.9 | 17.8 | 49.4 | 25.3 | 3.91 |
| Innovativeness, e.g., new ways to use wood in housing | 1.2 | 10.2 | 26.8 | 45.7 | 16.1 | 3.65 |
| Retailer, e.g., the salesperson’s knowledge of wood | 2.7 | 7.8 | 26.2 | 37.9 | 25.4 | 3.75 |
| Table 5. Results from the final rotated four-factor solution on the variables affecting the perceived quality of wooden interior products. Bolded values are the highest factor loadings in absolute values. | |||||
| Variable | Communalities (Extraction) | Factor 1 Environmental friendliness | Factor 2 Fit with lifestyle and home design | Factor 3 Visual and tactile attractiveness | Factor 4 Technical solidity |
| Information related to, e.g., product origin, production process, and environmental effects | 0.767 | 0.847 | 0.171 | 0.058 | 0.131 |
| Product certificates, e.g., Swan Ecolabel, PEFC, FSC | 0.725 | 0.816 | 0.063 | 0.086 | 0.220 |
| Origin, e.g., the domesticity of wood | 0.576 | 0.648 | 0.346 | 0.117 | 0.149 |
| Environmental aspects, e.g., environmental effects of wood | 0.555 | 0.670 | 0.256 | 0.119 | 0.163 |
| Coziness, e.g., wood enhances hominess | 0.456 | 0.070 | 0.603 | 0.243 | 0.167 |
| Multifunctionality, e.g., wood has many applications | 0.657 | 0.175 | 0.740 | 0.031 | 0.277 |
| Personal values, e.g., expressing one’s identity by using wood | 0.494 | 0.303 | 0.602 | 0.196 | 0.032 |
| Innovativeness, e.g., new ways to use wood in housing | 0.558 | 0.414 | 0.564 | 0.181 | 0.188 |
| Visual properties, e.g., surface patterns | 0.999 | 0.036 | 0.174 | 0.976 | 0.126 |
| Tactile properties, e.g., surface | 0.419 | 0.188 | 0.202 | 0.572 | 0.127 |
| Technical properties, e.g., solidity, hardness | 0.404 | 0.151 | 0.196 | 0.203 | 0.549 |
| Longevity, e.g., resistance against moisture and decay | 0.770 | 0.144 | 0.113 | 0.024 | 0.858 |
| Retailer, e.g., the salesperson’s knowledge of wood | 0.301 | 0.276 | 0.194 | 0.115 | 0.417 |
| Cronbach’s a | 0.870 | 0.780 | 0.763 | 0.665 | |
| Eigenvalues | 5.138 | 1.594 | 1.261 | 1.102 | |
| Explained variance, % | 15.774 | 29.442 | 7.309 | 6.543 | |
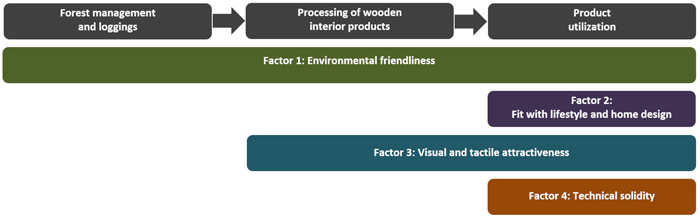
Fig. 2. Connections between four-factor solution for consumer views on wooden interior product quality and different phases of forestry-wood value chains. View larger in new window/tab.
| Table 6. Mann-Whitney U test results, which showed statistically significant differences in respondent views on wooden interior product quality indicators (i.e., factors derived from exploratory factor analysis) by sociodemographic groups. | ||
| Factor | Groups compared | p-value |
| Fit with lifestyle and home design | Female vs. male | 0.028** |
| Visual and tactile attractiveness | Female vs. male | 0.082* |
| Fit with lifestyle and home design | Forest sector involvement vs. no forest sector involvement | 0.004*** |
| Technical solidity | Forest sector involvement vs. no forest sector involvement | 0.023** |
| Fit with lifestyle and home design | Forest ownership vs. no forest ownership | 0.068* |
| * = Suggestive evidence on statistical significance = 0.05 ≤ p-value < 0.1; ** = Moderate evidence on statistical significance = 0.01 ≤ p-value < 0.05; *** = Very strong evidence on statistical significance = ˂ 0.01 p-value. | ||
| Table 7. Kruskal-Wallis test results, which showed statistically significant differences in respondent views on wooden interior product quality indicators (i.e., factors derived from exploratory factor analysis) by sociodemographic groups. | |||
| Factor | Groups compared | p-value for all groups | p-value for groupwise comparisons |
| Environmental friendliness | All age groups | 0.037** | |
| 18–34 years vs. 35–59 years | 0.238 | ||
| 18–34 years vs. 60 years or older | 0.013** | ||
| 35–59 years vs. 60 years or older | 0.335 | ||
| Fit with lifestyle and home design | All education groups | 0.031** | |
| General upper secondary education vs. | 0.050** | ||
| higher education at university, other academic education | |||
| General upper secondary education vs. | 0.009*** | ||
| vocational upper secondary education | |||
| Basic education vs. | 0.037** | ||
| vocational upper secondary education | |||
| Vocational upper secondary education vs. | 0.092* | ||
| higher education at university of applied sciences | |||
| Technical solidity | All education groups | 0.001*** | |
| Basic education vs. | 0.012** | ||
| vocational upper secondary education | |||
| Basic education vs. | 0.013** | ||
| general upper secondary education | |||
| Higher education at university, other academic education vs. | 0.001*** | ||
| vocational upper secondary education | |||
| Higher education at university, other academic education vs. | 0.006*** | ||
| general upper secondary education | |||
| Vocational upper secondary education vs. | 0.022** | ||
| higher education at university of applied sciences | |||
| Higher education at university of applied sciences vs. | 0.039** | ||
| general upper secondary education | |||
| * = Suggestive evidence on statistical significance = 0.05 ≤ p-value < 0.1; ** = Moderate evidence on statistical significance = 0.01 ≤ p-value < 0.05; *** = Very strong evidence on statistical significance = ˂ 0.01 p-value. | |||