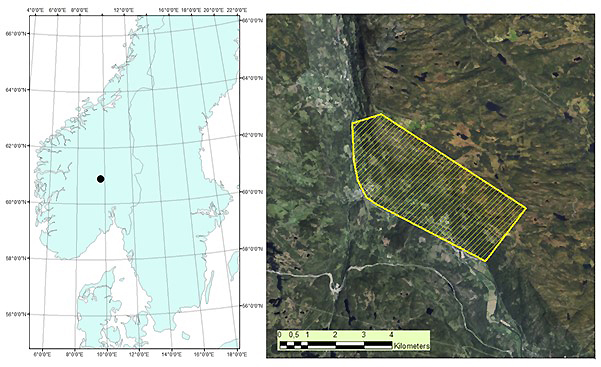
Fig. 1. Map of root, butt, and stem rot study area (yellow) in Etnedal. Location within Norway shown on left.
| Table 1. Spectral indices and derivatives calculated from hyperspectral data. | ||
| Abbreviation | Variable name | Reference |
| NDVI* | Normalized Difference Vegetation Index | Rouse et al. 1973 |
| SRI | Simple Ratio Index | Birth and McVey 1968 |
| ARVI* | Atmospherically Resistant Vegetation Index | Kaufman and Tanre 1992 |
| RENDVI | Red Edge Normalized Difference Vegetation Index | Sims and Gammon 2002 |
| MRESRI | Modified Red Edge Simple Ratio Index | Datt 1999 |
| MRENDVI | Modified Red Edge Normalized Difference Vegetation Index | Datt 1999 |
| VREI1 | Vogelmann Red Edge Index 1 | Vogelmann et al. 1993 |
| REPI | Red Edge Position Index | Curran et al. 1995 |
| SIPI | Structure Insensitive Pigment Index | Penuelas et al. 1995 |
| RGRI* | Red Green Ratio Index | Gammon and Surfus 1999 |
| WBI | Water Band Index | Panuelas et al. 1993 |
| NDWI | Normalized Difference Water Index | Gao 1995 |
| MSI | Moisture Stress Index | Ceccato et al. 2001 |
| NDII | Normalized Difference Infrared Index | Hardisky et al. 1983 |
| Dvn1 | First Derivative of VNIR Spectra | |
| Dvn2 | Second Derivative of VNIR Spectra | |
| Dsw1 | First Derivative of SWIR Spectra | |
| Dsw2 | Second Derivative of SWIR Spectra | |
| Astrices (*) indicate a broad-band index. All others are narrow-band. | ||
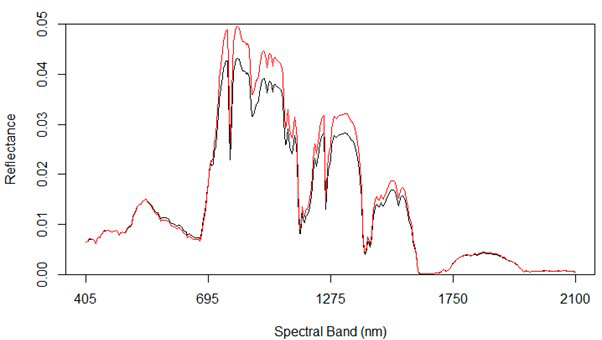
Fig. 2. Spectral graph of hyperspectral data showing both uninfected (red) and infected (black) trees.
| Table 2. Support vector machine (SVM) classification results of rot detection. | ||||||
| Variable combinations1 | PA-No Rot2 | PA-Rot | UA-No Rot3 | UA-Rot | OA4 | Kappa |
| VNIR_INDEXES_Dvn2 | 61.21 | 64.40 | 85.44 | 32.7 | 61.94 | 0.190 |
| VNIR_Dvn2 | 59.74 | 65.25 | 85.45 | 32.24 | 61.03 | 0.184 |
| VNIR_SWIR_INDEXES_Dvn1_Dvn2 | 59.87 | 65.01 | 85.37 | 32.19 | 61.03 | 0.183 |
| VNIR_SWIR_Dvn1 | 59.69 | 65.13 | 85.39 | 32.13 | 60.92 | 0.181 |
| VNIR_SWIR_Dvn1_Dvn2 | 59.30 | 65.49 | 85.43 | 32.05 | 60.70 | 0.181 |
| VNIR_SWIR | 57.70 | 67.43 | 85.80 | 31.85 | 59.90 | 0.180 |
| 1 Variable combinations refer to the groups of variables which were included in the model. They are labelled as follows: VNIR: Average values of VNIR Bands; SWIR: Average Values of SWIR Bands; Dvn1: 1st derivatives of VNIR Bands; Dvn2: 2nd derivatives of VNIR Bands; Dsw1: 1st derivatives of SWIR bands; Dsw2: 2nd derivatives of SWIR bands; INDEXES: Spectral indices. For example, the model run labelled VNIR_INDEXES_Dvn2 included only VNIR spectral values, spectral indices, and second derivatives of the VNIR bands. 2 PA: Producer’s Accuracy. 3 UA: User’s Accuracy. 4 OA: Overall Accuracy. | ||||||
| Table 3. Confusion matrix for the best random forest classification of rot presence. | ||||
| Prediction | Reference | |||
| No Rot | Rot | Total | User’s Accuracy (%) | |
| No Rot | 307 | 141 | 448 | 68.52 |
| Rot | 208 | 336 | 544 | 61.76 |
| Total | 515 | 477 | 992 | |
| Producer’s Accuracy (%) | 59.61 | 70.04 | ||
| Overall Accuracy | 64.81 | κ: 0.27 | ||
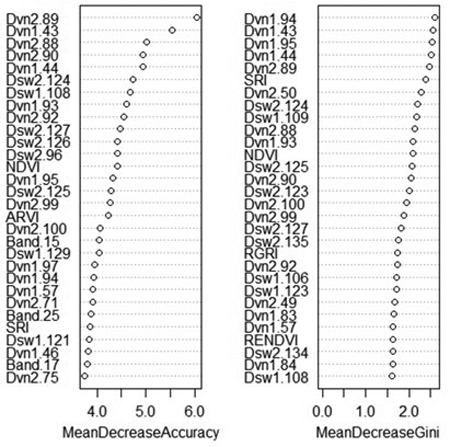
Fig. 3. Variable importance plot from random forest classification of rot presence. Variables marked “Band” are average reflectance values; “Dvn” refers to a derivative of a band from the VNIR sensor, while “Dsw” refers to a derivative of a band from the SWIR sensor. The numbers after the variable name refer to the number of each band, or the spectral derivative thereof. MeanDecreaseAccuracy: decrease in model out-of-bag accuracy when a specific variable is removed. MeanDecreaseGini: additional heterogeneity introduced into the nodes and leaves of each tree when a variable is removed.