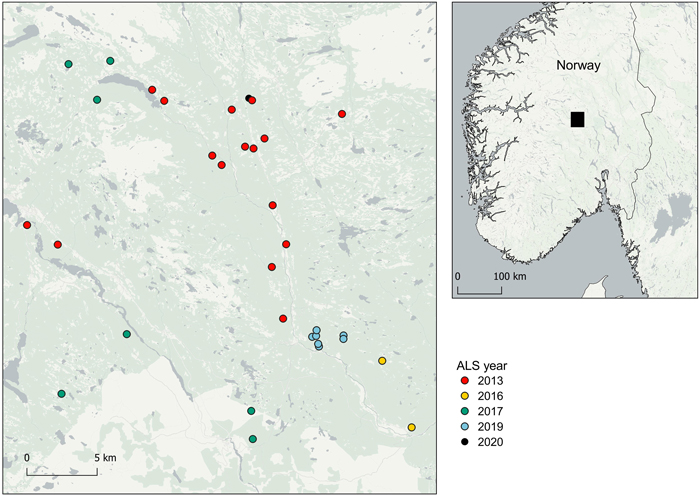
Fig. 1. Overview map of the logging sites from which harvester data were collected, and corresponding airborne laser scanning datasets with year of acquisition (ALS year).
| Table 1. Airborne laser scanning acquisition parameters, footprint diameters and pulse densities. | ||||||||
| Year | Instrument | Time period | Pulse rate (kHz) | Scan rate (Hz) | Flying altitude (m) | Scanning angle (±°) | Footprint diameter (m) | Pulse density (m–2) |
| 2013 | TopEye S/N 444 | May–July | 200 | 92 | 1500 | 20 | 0.28 | 7.7 |
| 2016 | Riegl LMS Q-1560 | September | 400 | 100 | 2900 | 20 | 0.25 | 3.2 |
| 2017 | Riegl VQ-1560 I | July | 700 | 240 | 2300 | 20 | 0.58 | 6.8 |
| 2019 | Leica ALS70-HP | August | 495 | 69 | 1150 | 16 | 0.73 | 5.9 |
| 2020 | Riegl VQ-1560 II | June | 749 | 158 | 1100 | 29 | 0.75 | 10.4 |
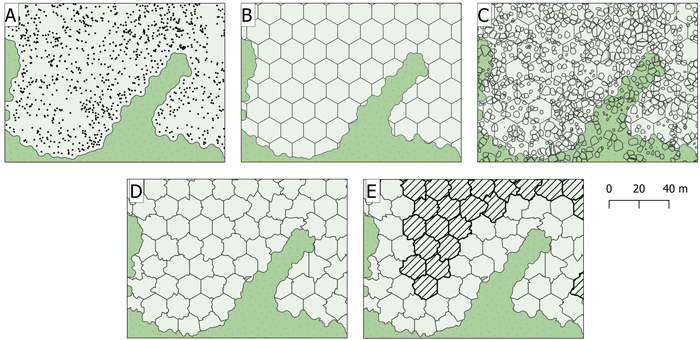
Fig. 2. The enhanced area-based inventory approach used in this study. (A) buffer around positions of harvested stems, (B) hexagonal grid, (C) overlay with polygons of tree crowns segmented from the ALS data, (D) cell borders adjusted for segmented trees and sliver cells and (E) cells within a –15 m buffer used in Monte Carlo simulations marked with dashed lines.
| Table 2. Number of cells (n), selected predictors, model fit statistics for different cell sizes and accuracies of timber volume estimates for logging operations. | ||||||||
| Cell size (m2) | n | Predictors | Pseudo R2 | RMSE%w | ME%w | Min error (m3 ha–1) | Max error (m3 ha–1) | Mean error (m3 ha–1) |
| 100 | 10595 | Hmax + Hmean + D1 | 0.52 | 14.93 | –0.06 | –87.6 | 58.9 | 0.3 |
| 200 | 5707 | Hmean + D0 | 0.59 | 14.07 | –0.04 | –83.4 | 67.9 | 3.4 |
| 300 | 3929 | Hmean + D0 | 0.63 | 14.30 | –0.27 | –88.7 | 64.5 | 2.3 |
| 400 | 3038 | H80 + D0 | 0.63 | 12.71 | –0.32 | –74.7 | 56.9 | 3.1 |
| Table 3. Logging operation level statistics for harvester data obtained from the 33 operations. | ||||
| Min | Mean | Max | Std.dev | |
| Mean timber volume (m3 ha–1) | 115 | 248 | 419 | 84 |
| Mean diameter at breast height (mm) | 157 | 209 | 277 | 29 |
| Number of stems | 4442 | 149 629 | 518 012 | 125 542 |
| Harvested area (ha) | 0.14 | 3.03 | 10.21 | 2.64 |
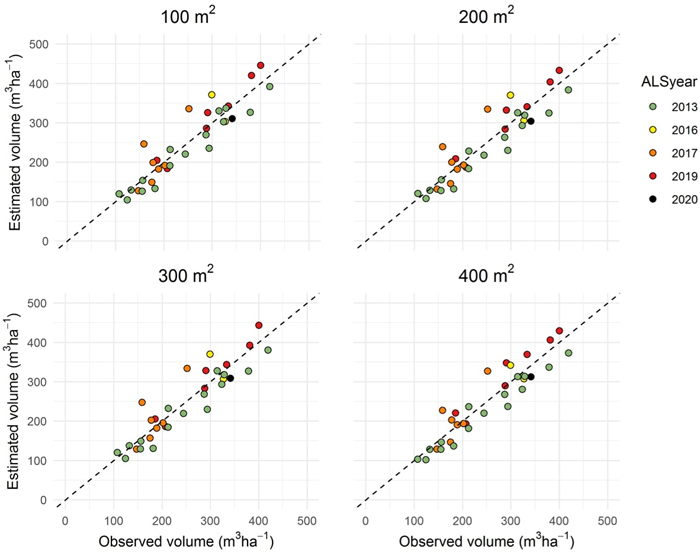
Fig. 3. Observed timber volume plotted against timber volume estimated from airborne laser scanner (ALS) data acquired from 2013 to 2020 (ALSyear) for the 33 logging operations and four cell sizes.
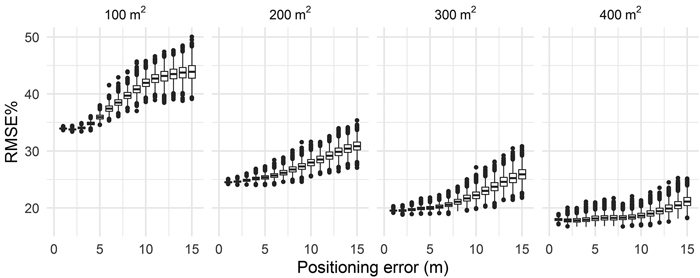
Fig. 4. Mean values of RMSE% of cell level timber volume predictions obtained for the four cell sizes and simulated positioning errors of harvested stems.
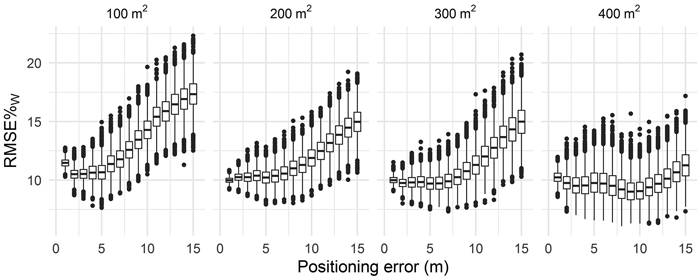
Fig. 5. Mean values of RMSE%w of timber volume estimates at logging operation level obtained for the four cell sizes and simulated positioning errors of harvested stems.