| Table 1. The number of pedunculate oak seedlings of four southern Finnish populations that were used to assess maximum frost hardiness in midwinter in February (Transfer 1) and in March (Transfer 2) 1999 in conditions in central Finland. | |||
| Population | February (Transfer 1) | March (Transfer 2) | Total |
| Lohja | 144 | 147 | 291 |
| Parainen | 123 | 142 | 265 |
| Ruissalo | 140 | 126 | 266 |
| Tenhola | 168 | 117 | 285 |
| Table 2. Descriptive statistics for the initiation and peak of the low temperature exotherm (LTE) of four Finnish pedunculate oak populations assessed by differential thermal analysis. The seedlings were transferred from outside to the growth chamber at –2 °C in February 1999 (Transfer 1) and March 1999 (Transfer 2) before the start of the freezing tests. The mean value of each population is in bold. The significances of the differences (P-value) among the populations and transfer times are given in the lower panel. | |||||
| Transfer | Item | Initiation of LTE, °C | |||
| Lohja | Parainen | Ruissalo | Tenhola | ||
| 1 | Mean | -40.8 | -41.9 | -40.7 | -40.8 |
| Minimum | -44.8 | -44.7 | -44.9 | -43.8 | |
| Maximum | -36.8 | -39.0 | -37.1 | -37.3 | |
| Median | -40.9 | -42.3 | -40.8 | -41.2 | |
| Std. deviation | 2.2 | 1.6 | 2.1 | 1.7 | |
| 2 | Mean | -41.0 | -40.8 | -41.2 | -40.9 |
| Minimum | -45.5 | -43.7 | -44.6 | -44.0 | |
| Maximum | -37.9 | -34.6 | -36.4 | -36.8 | |
| Median | -40.7 | -41.1 | -41.3 | -41.4 | |
| Std. deviation | 1.7 | 2.4 | 2.0 | 1.6 | |
| Peak of LTE, °C | |||||
| 1 | Mean | -43.2 | -44.4 | -43.4 | -43.2 |
| Minimum | -45.9 | -46.7 | -45.5 | -45.4 | |
| Maximum | -39.0 | -41.9 | -39.8 | -39.2 | |
| Median | -43.6 | -44.7 | -43.7 | -43.7 | |
| Std. deviation | 1.9 | 1.4 | 1.8 | 1.8 | |
| 2 | Mean | -42.9 | -43.0 | -43.6 | -43.1 |
| Minimum | -46.9 | -46.3 | -46.5 | -45.7 | |
| Maximum | -40.0 | -37.1 | -40.3 | -38.2 | |
| Median | -42.8 | -43.4 | -44.0 | -43.5 | |
| Std. deviation | 1.7 | 2.3 | 1.8 | 1.7 | |
| P-value | |||||
| Source of variation | Initiation of LTE | Peak of LTE | |||
| Population (P) | 0.903 | 0.618 | |||
| Transfer (T) | 0.964 | 0.293 | |||
| P × T | 0.538 | 0.483 | |||
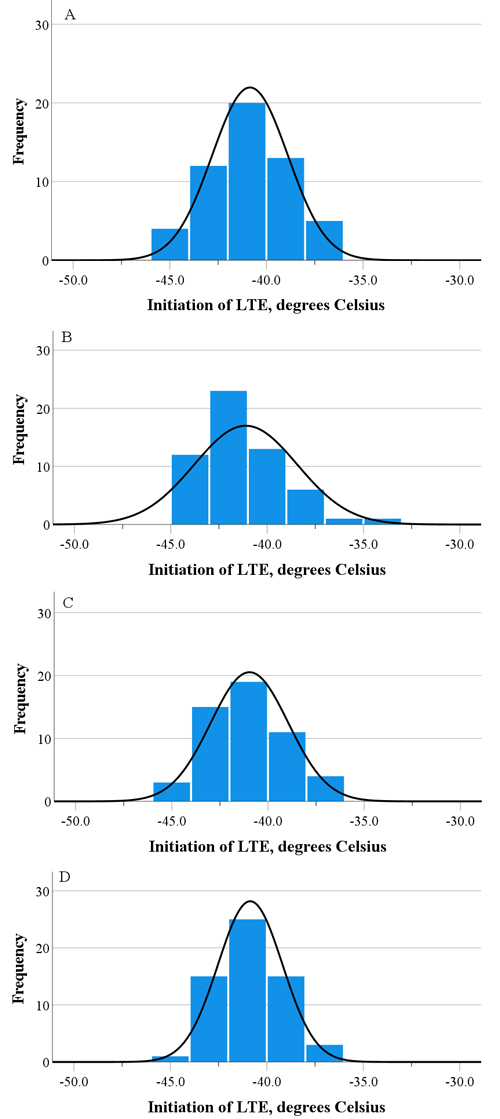
Fig. 1. The distribution of the LTE initiation assessed by differential thermal analysis for four Finnish pedunculate oak populations, i.e. Lohja (A), Parainen (B), Ruissalo (C), and Tenhola (D), according to the pooled data of two transfer times in February and March.
| Table 3. The mean parameter estimates and their confidence intervals of the logistic sigmoid function (Eq. 2) fitted the data of the relative electrolyte leakage of stems of four Finnish populations of pedunculate oak seedlings that were tested for frost hardiness in February 1999 (Transfer 1) and March 1999 (Transfer 2). The values are the means of the two chambers. The frost hardiness as the inflection point of the fitted function and its 95% confidence intervals are in bold. | ||||||
| Origin | Transfer | Parameter | Parameter estimate | 95% confidence interval | R2 | |
| Lower | Upper | |||||
| Lohja | 1 | A | 0.51 | 0.47 | 0.55 | 0.93 |
| 1 | B | -0.24 | -0.32 | -0.17 | ||
| 1 | C | -44.0 | -45.5 | -42.5 | ||
| 1 | D | 0.35 | 0.32 | 0.37 | ||
| 2 | A | 0.45 | 0.41 | 0.49 | 0.94 | |
| 2 | B | -0.15 | -0.19 | -0.11 | ||
| 2 | C | -41.6 | -43.5 | -39.7 | ||
| 2 | D | 0.30 | 0.27 | 0.32 | ||
| Parainen | 1 | A | 0.56 | 0.51 | 0.61 | 0.91 |
| 1 | B | -0.25 | -0.35 | -0.15 | ||
| 1 | C | -46.6 | -48.2 | -45.0 | ||
| 1 | D | 0.34 | 0.31 | 0.37 | ||
| 2 | A | 0.45 | 0.43 | 0.47 | 0.97 | |
| 2 | B | -0.24 | -0.28 | -0.19 | ||
| 2 | C | -41.1 | -42.0 | -40.2 | ||
| 2 | D | 0.32 | 0.31 | 0.34 | ||
| Ruissalo | 1 | A | 0.55 | 0.49 | 0.60 | 0.89 |
| 1 | B | -0.24 | -0.34 | -0.15 | ||
| 1 | C | -45.0 | -46.8 | -43.1 | ||
| 1 | D | 0.39 | 0.36 | 0.43 | ||
| 2 | A | 0.50 | 0.46 | 0.53 | 0.96 | |
| 2 | B | -0.16 | -0.19 | -0.12 | ||
| 2 | C | -40.6 | -42.0 | -39.2 | ||
| 2 | D | 0.29 | 0.27 | 0.31 | ||
| Tenhola | 1 | A | 0.54 | 0.48 | 0.60 | 0.88 |
| 1 | B | -0.23 | -0.35 | -0.12 | ||
| 1 | C | -46.4 | -48.5 | -44.4 | ||
| 1 | D | 0.35 | 0.31 | 0.38 | ||
| 2 | A | 0.48 | 0.46 | 0.50 | 0.98 | |
| 2 | B | -0.19 | -0.22 | -0.16 | ||
| 2 | C | -41.2 | -42.2 | -40.3 | ||
| 2 | D | 0.30 | 0.29 | 0.32 | ||
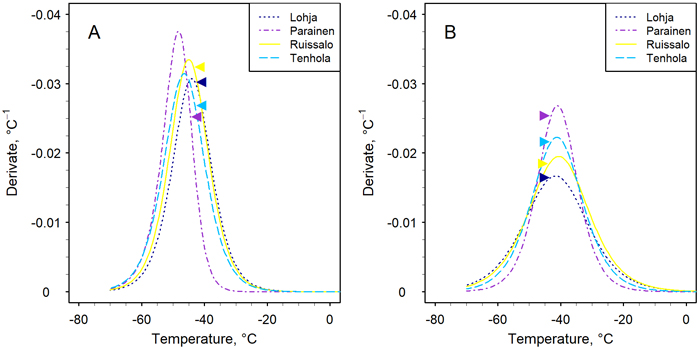
Fig. 2. The first derivative (Eq. 3) of the sigmoid function (Eq. 2) fitted the data of the relative leakage method to assess the frost hardiness of the stems of four Finnish pedunculate oak populations. The assessment took place on two occasions in midwinter in February (A) and March (B). The position of the peak indicates the frost hardiness, i.e. parameter C in Eq. 2 (Table 3). The arrows indicate the location of the mean LTEpeak on the curve of each population (see Table 2).
| Table 4. Frost hardiness (LT50) of buds, and of phloem and xylem, of the stems of four Finnish pedunculate oak populations as assessed by controlled freezing tests and visual damage scoring in midwinter in February (Transfer 1) and March (Transfer 2). | |||||
| Transfer | Item | LT50, °C | |||
| Lohja | Parainen | Ruissalo | Tenhola | ||
| 1 | Bud | -27 | -20 | -22 | -19 |
| Phloem | -34 | -40 | -27 | -33 | |
| Xylem | -43 | -35 | -30 | -39 | |
| 2 | Bud | -29 | -27 | -33 | -33 |
| Phloem | -58 | -34 | -33 | -38 | |
| Xylem | -32 | -33 | -31 | -34 | |