| Table 1. Description of the pixel data from Central and Eastern Norway used in the case study. The table shows the number of pixels for each site index / initial rot level combination and its cumulative distribution in the last row. | ||||||||||||||||||||||
| Site Index spruce | Rot level (%) | |||||||||||||||||||||
| 0 | 5 | 10 | 15 | 20 | 25 | 30 | 35 | 40 | 45 | 50 | 55 | 60 | 65 | 70 | 75 | 80 | 85 | 90 | 100 | Total | ||
| 10 | 321 | 131 | 148 | 129 | 106 | 61 | 43 | 27 | 19 | 21 | 11 | 4 | 4 | 2 | 1 | 1 | 1 | 1 | 1 | 0 | 1032 | |
| 12 | 895 | 365 | 290 | 253 | 135 | 114 | 81 | 47 | 42 | 22 | 19 | 8 | 5 | 6 | 1 | 2 | 1 | 1 | 1 | 0 | 2288 | |
| 14 | 1235 | 583 | 468 | 399 | 319 | 228 | 208 | 133 | 129 | 102 | 48 | 43 | 21 | 20 | 14 | 6 | 3 | 0 | 1 | 0 | 3960 | |
| 16 | 816 | 281 | 225 | 145 | 104 | 80 | 54 | 37 | 35 | 28 | 27 | 20 | 11 | 5 | 3 | 3 | 2 | 0 | 0 | 1 | 1877 | |
| 18 | 523 | 286 | 202 | 162 | 112 | 72 | 55 | 43 | 23 | 22 | 13 | 14 | 6 | 4 | 3 | 0 | 0 | 1 | 1 | 0 | 1542 | |
| 20 | 697 | 290 | 226 | 190 | 110 | 75 | 48 | 34 | 26 | 18 | 3 | 8 | 1 | 2 | 0 | 0 | 0 | 0 | 0 | 0 | 1728 | |
| 22 | 13 | 9 | 7 | 7 | 3 | 2 | 5 | 1 | 0 | 0 | 1 | 0 | 0 | 0 | 0 | 0 | 0 | 0 | 0 | 0 | 48 | |
| Total | 4500 | 1945 | 1566 | 1285 | 889 | 632 | 494 | 322 | 274 | 213 | 122 | 97 | 48 | 39 | 22 | 12 | 7 | 3 | 4 | 1 | 12 475 | |
| Distr. | 36% | 52% | 64% | 75% | 82% | 87% | 91% | 93% | 95% | 97% | 98% | 99% | 99% | 100% | 100% | 100% | 100% | 100% | 100% | 100% | ||
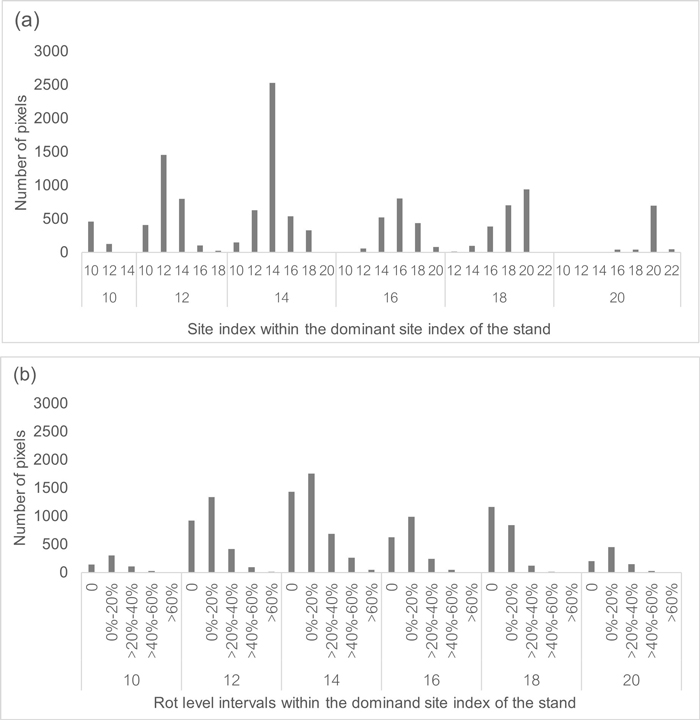
Fig. 1. Pixel data distribution regarding site index and rot level within the 71 stands analysed in central and eastern Norway. (a) Site index distribution when aggregating the stands by its dominant site index (heterogeneous areas). (b) Rot level intervals distribution when aggregating the stands by their dominant site index (heterogeneous areas).
| Table 2. Optimal tree species for each combination of site index, initial rot level, and rotation length. P stands for Pinus sylvestris (pine) and S for Picea abies (spruce). The economically optimal rotation age (NPV based considering an interest rate of 3%) for each site index given a homogenous rot level is indicated in bold. The brackets indicate negative NPVs, while the lack indicates positive NPVs. | ||||||||||||||||||||||
| H40 Site Index | Rotation length (years) | Initial rot level (%) | ||||||||||||||||||||
| 0 | 5 | 10 | 15 | 20 | 25 | 30 | 35 | 40 | 45 | 50 | 55 | 60 | 65 | 70 | 75 | 80 | 85 | 90 | 95 | 100 | ||
| Spruce -10 | 55–80 | (P) | (P) | (P) | (P) | (P) | (P) | (P) | (P) | (P) | (P) | (P) | (P) | (P) | (P) | (P) | (P) | (P) | (P) | (P) | (P) | (P) |
| Pine -12 | 85 | (P) | (P) | (P) | (P) | (P) | (P) | (P) | (P) | (P) | (P) | (P) | (P) | (P) | (P) | (P) | (P) | (P) | (P) | (P) | (P) | (P) |
| 90 | (P) | (P) | (P) | (P) | (P) | (P) | (P) | (P) | (P) | (P) | (P) | (P) | (P) | (P) | (P) | (P) | (P) | (P) | (P) | (P) | (P) | |
| Spruce - 12 | 55–75 | (P) | (P) | (P) | (P) | (P) | (P) | (P) | (P) | (P) | (P) | (P) | (P) | (P) | (P) | (P) | (P) | (P) | (P) | (P) | (P) | (P) |
| Pine - 13 | 80 | (P) | (P) | (P) | (P) | (P) | (P) | (P) | (P) | (P) | (P) | (P) | (P) | (P) | (P) | (P) | (P) | (P) | (P) | (P) | (P) | (P) |
| 85 | (S) | (P) | (P) | (P) | (P) | (P) | (P) | (P) | (P) | (P) | (P) | (P) | (P) | (P) | (P) | (P) | (P) | (P) | (P) | (P) | (P) | |
| 90 | (S) | (S) | (P) | (P) | (P) | (P) | (P) | (P) | (P) | (P) | (P) | (P) | (P) | (P) | (P) | (P) | (P) | (P) | (P) | (P) | (P) | |
| Spruce - 14 | 55 | (P) | (P) | (P) | (P) | (P) | (P) | (P) | (P) | (P) | (P) | (P) | (P) | (P) | (P) | (P) | (P) | (P) | (P) | (P) | (P) | (P) |
| Pine - 14 | 60 | (S) | (P) | (P) | (P) | (P) | (P) | (P) | (P) | (P) | (P) | (P) | (P) | (P) | (P) | (P) | (P) | (P) | (P) | (P) | (P) | (P) |
| 65–70 | (S) | (S) | (P) | (P) | (P) | (P) | (P) | (P) | (P) | (P) | (P) | (P) | (P) | (P) | (P) | (P) | (P) | (P) | (P) | (P) | (P) | |
| 75 | S | (S) | (S) | (P) | (P) | (P) | (P) | (P) | (P) | (P) | (P) | (P) | (P) | (P) | (P) | (P) | (P) | (P) | (P) | (P) | (P) | |
| 80 | S | S | (S) | (P) | (P) | (P) | (P) | (P) | (P) | (P) | (P) | (P) | (P) | (P) | (P) | (P) | (P) | (P) | (P) | (P) | (P) | |
| 85 | S | S | (S) | (S) | (P) | (P) | (P) | (P) | (P) | (P) | (P) | (P) | (P) | (P) | (P) | (P) | (P) | (P) | (P) | (P) | (P) | |
| 90 | S | (S) | (S) | (S) | (P) | (P) | (P) | (P) | (P) | (P) | (P) | (P) | (P) | (P) | (P) | (P) | (P) | (P) | (P) | (P) | (P) | |
| Spruce - 16 | 55 | S | (S) | (P) | (P) | (P) | (P) | (P) | (P) | (P) | (P) | (P) | (P) | (P) | (P) | (P) | (P) | (P) | (P) | (P) | (P) | (P) |
| Pine - 16 | 60 | S | S | P | P | P | P | P | P | P | P | P | P | P | P | P | P | P | (P) | (P) | (P) | (P) |
| 65 | S | S | S | P | P | P | P | P | P | P | P | P | P | P | P | P | P | P | P | P | P | |
| 70 | S | S | S | P | P | P | P | P | P | P | P | P | P | P | P | P | P | P | P | P | P | |
| 75 | S | S | S | S | P | P | P | P | P | P | P | P | P | P | P | P | P | P | P | P | P | |
| 80 | S | S | S | S | P | P | P | P | P | P | P | P | P | P | P | P | P | P | P | P | P | |
| 85–90 | S | S | S | S | S | P | P | P | P | P | P | P | P | P | P | P | P | P | P | P | P | |
| Spruce - 18 | 55 | S | S | S | S | S | P | P | P | P | P | P | P | P | P | P | P | P | P | P | (P) | (P) |
| Pine - 17 | 60–65 | S | S | S | S | S | P | P | P | P | P | P | P | P | P | P | P | P | P | P | P | P |
| 70 | S | S | S | S | S | S | P | P | P | P | P | P | P | P | P | P | P | P | P | P | P | |
| 75 | S | S | S | S | S | S | P | P | P | P | P | P | P | P | P | P | P | P | P | P | P | |
| 80–90 | S | S | S | S | S | S | P | P | P | P | P | P | P | P | P | P | P | P | P | P | P | |
| Spruce - 20 | 55–65 | S | S | S | S | S | S | S | P | P | P | P | P | P | P | P | P | P | P | P | P | P |
| Pine - 18 | 70 | S | S | S | S | S | S | S | P | P | P | P | P | P | P | P | P | P | P | P | P | P |
| 75–90 | S | S | S | S | S | S | S | P | P | P | P | P | P | P | P | P | P | P | P | P | P | |
| Spruce - 22 | 55–60 | S | S | S | S | S | S | S | P | P | P | P | P | P | P | P | P | P | P | P | P | P |
| Pine - 20 | 65 | S | S | S | S | S | S | S | P | P | P | P | P | P | P | P | P | P | P | P | P | P |
| 70 | S | S | S | S | S | S | S | S | P | P | P | P | P | P | P | P | P | P | P | P | P | |
| 75–85 | S | S | S | S | S | S | S | S | P | P | P | P | P | P | P | P | P | P | P | P | P | |
| 90 | S | S | S | S | S | S | S | P | P | P | P | P | P | P | P | P | P | P | P | P | P | |
| Spruce - 24 | 55–60 | S | S | S | S | S | S | S | S | P | P | P | P | P | P | P | P | P | P | P | P | P |
| Pine - 21 | 65 | S | S | S | S | S | S | S | S | S | P | P | P | P | P | P | P | P | P | P | P | P |
| 70 | S | S | S | S | S | S | S | S | S | P | P | P | P | P | P | P | P | P | P | P | P | |
| 75 | S | S | S | S | S | S | S | S | S | P | P | P | P | P | P | P | P | P | P | P | P | |
| 80–85 | S | S | S | S | S | S | S | S | P | P | P | P | P | P | P | P | P | P | P | P | P | |
| 90 | S | S | S | S | S | S | S | P | P | P | P | P | P | P | P | P | P | P | P | P | P | |
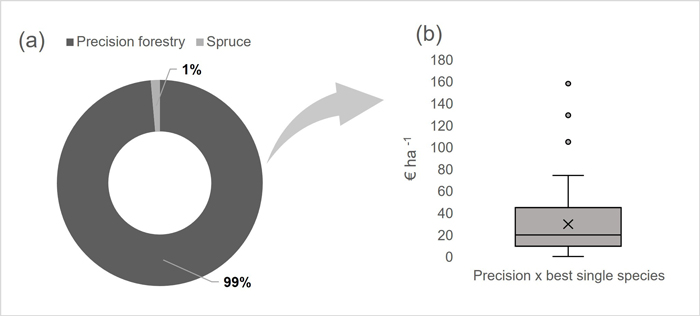
Fig. 2. Precision forestry method results. (a) Share of stands where the most profitable option was planting Picea abies (spruce) only or planting mixed species according to the site index and rot level (Precision forestry). (b) Increase in LEV (€ ha–1) observed in the stands where Precision forestry yields the best results. The values are obtained by comparing the results of the Precision forestry method to the best single species (only Picea abies or Pinus sylvestris – whichever is the best) alternative.
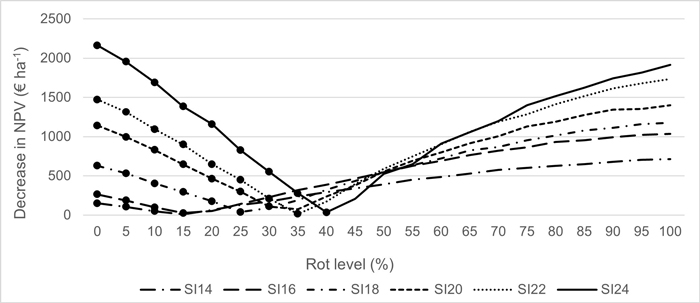
Fig. 3. Decrease in NPV (€ ha–1), considering the economically optimal rotation age when choosing the non-optimal species. The bulleted part of the graph refers to the losses when planting Pinus sylvestris (pine) instead of Picea abies (spruce) in a homogeneous area. The non-bulleted part of the graph refers to the losses when planting Picea abies (spruce) instead of Pinus sylvestris (pine) in a homogeneous area. The lines refer to different site indexes.