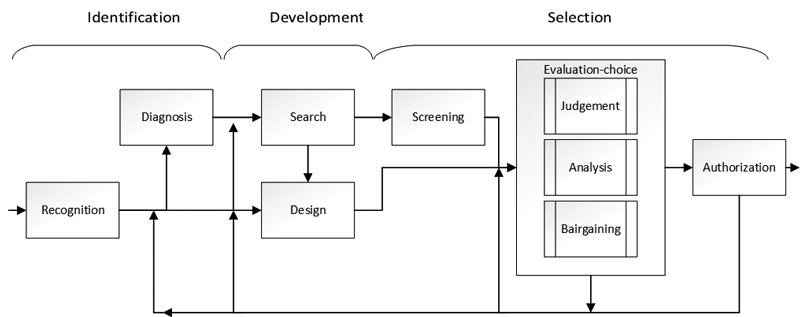
Fig. 1. The structure of “unstructured” decision processes according to Mintzberg et al. (1976).
| Table 1. The criteria for selection of respondents and a brief presentation of respondents’ data. Semi-structured interviews were conducted by the main author, face-to-face. | |
| Category | Description |
| Criteria for selecting respondents | 1) Experience of R&D at a forest company or FOA at staff level or similar 2) Experience from working in the Harwarder Collaboration Group |
| Number of respondents | 6 from forest companies*, 1 from a FOA |
| Current roles of respondents | Staff manager, project leader or specialist |
| Education of respondents | University degree in forestry, engineering, or similar |
| Experience in the forest sector, years | 10–30 years, 27 on average, in operational, tactical, and/or strategic activities |
| * Two respondents undergoing a role transition were chosen from one user. | |
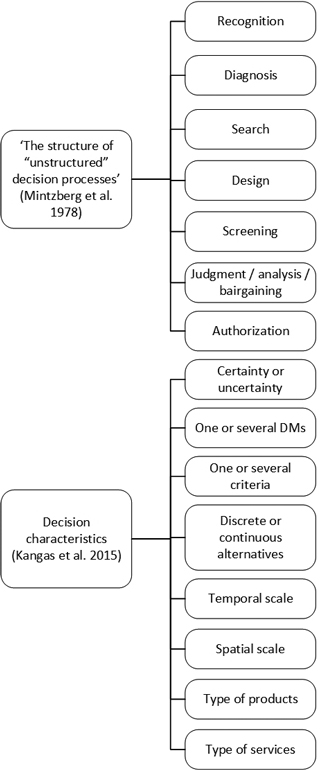
Fig. 2. The coding tree for the analysis of the interview transcripts, was based on two theoretical frameworks.
| Table 2. The relative frequencies at which interviewees mentioned the use of different decision-making routines, arranged by the routines’ order of occurrence in the model of Mintzberg et al. (1976). Frequency is categorized using a scale where 1 and 7 represent the lowest and highest frequencies, respectively. Descriptions covers a synthesis of the respondents’ replies for each routine. | ||
| Routine | Relative frequency | Description |
| Recognition | 5 | Problems, stemming from motives for participating in development and reducing costs while maintaining acceptable social and environmental performance |
| Diagnosis | 2 | Have we gathered relevant information to start? Are we doing relevant things? |
| Search | 4 | Searching for new technology |
| Design | 6 | Redesign of technology similar to what we want to develop |
| Screening | 1 | |
| Judgment/Analysis/ Bargaining | 7 | Analysis by researchers, tests within the respondents’ organization and those of other users, decisions within the own organization’s development group |
| Authorization | 3 | Anchoring with the board of directors, and sometimes also by contractors |
| Table 3. Characteristics of development decisions as described by the respondents, interpreted through the framework of Kangas et al. (2015). | |
| Decision characteristic | Description |
| Certainties or uncertainties | 2–10 per respondent. Examples included stand conditions (7), operators’ impact on productivity (4), and other users’ decisions (3) |
| One or several criteria | 4–14 per respondent. Examples included costs (27), operator environment (9), and machine availability (4) |
| Discrete or continuous alternatives | Discrete; machines/machine systems |
| One or several decision-makers | One or few, frequently with input from influential executers/experts (contractors, wood value specialists etc.) |
| Spatial scale | In which kinds of stands and how many stands will the new technology perform better than current alternatives? |
| Temporal scale | Strategic, tactical, and operational impact |
| Type of product | Machine systems/machines and operation services (logging and logistics) |