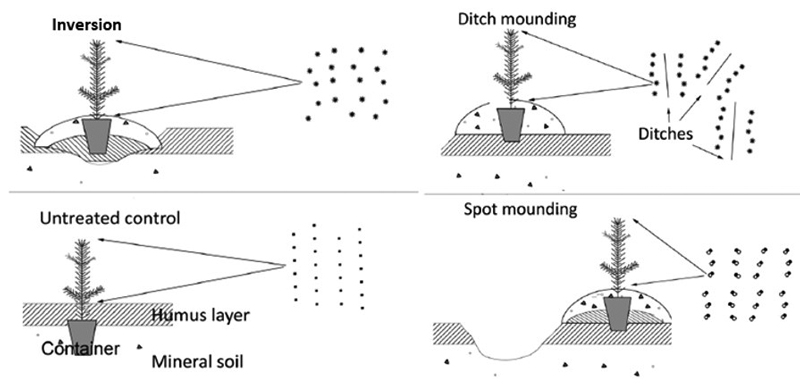
Fig. 1. Schematic illustration for the site preparation treatments of ditch and spot mounding, inversion and untreated control drawn from aside (single seedling) and above (multiple seedlings).
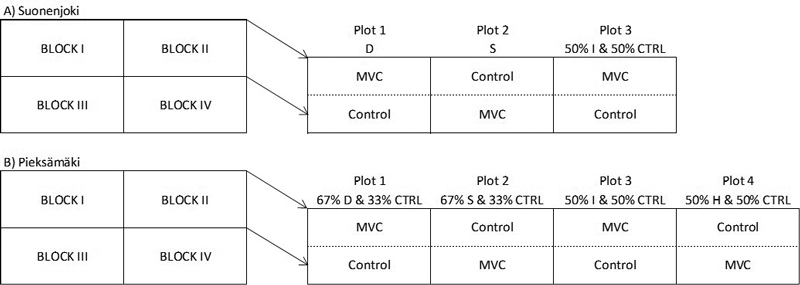
Fig. 2. Schematic graph of the study design A) Suonenjoki and B) Pieksämäki sites in Finland. The percentage of initial planting spots in each plot is shown next to the abbreviation of site preparation methods in plots containing two site preparation methods (mounding or herbicide, and control). Soil preparation plot is split in to sub plots according to two mechanical vegetation control methods (MVC and control). Size of a sub plot with edge area is 20 × 16 m (320 m2), and the circular sample taken from the center of each sub plot is 50 m2. Abbreviations; D = ditch mounding, S = spot mounding, I = inversion, CTRL = unprepared soil, H = Herbicide treatment after planting.
| Table 1. Observations of spruce saplings in different treatments in Suonenjoki and Pieksämäki sites in south-boreal forest in Finland. The target share indicates the targeted share of planted seedlings on a prepared point or between them in unprepared control points (CTRL) within plots. The p-value is the result of binomial test of equality of the proportion (50%) of measured saplings between mechanical vegetation controlled (MVC) and untreated control plots. | ||||||||||
| Suonenjoki | Pieksämäki | |||||||||
| Observations | Observations | |||||||||
| Target share | MWC | Control | Total | p-value | Target share | MWC | Control | Total | p-value | |
| Inversion plots | ||||||||||
| Mound | 1/2 | 18 | 20 | 38 | 0.871 | 1/2 | 41 | 35 | 76 | 0.567 |
| CTRL | 1/2 | 7 | 5 | 12 | 0.774 | 1/2 | 16 | 16 | 32 | 1.000 |
| Spot mounding plots | ||||||||||
| Mound | 1/1 | 43 | 37 | 80 | 0.576 | 2/3 | 36 | 28 | 64 | 0.382 |
| CTRL | 1/3 | 11 | 4 | 15 | 0.119 | |||||
| Ditch mounding plots | ||||||||||
| Mound | 1/1 | 46 | 42 | 88 | 0.749 | 2/3 | 46 | 35 | 81 | 0.266 |
| CTRL | 1/3 | 6 | 10 | 16 | 0.754 | |||||
| Herbicide plots | ||||||||||
| Herbicide | 1/2 | 42 | 28 | 70 | 0.120 | |||||
| CTRL | 1/2 | 7 | 20 | 27 | 0.263 | |||||
| Total | 114 | 104 | 218 | 0.542 | 205 | 176 | 381 | 0.151 | ||
| Table 2. Mixed models for the height of spruce saplings at the Suonenjoki and Pieksämäki sites in south-boreal forest in Finland. The response variable is the natural logarithm of the sapling height in centimetres. The CTRL refers to control saplings planted in unprepared soil between seedlings undergoing different site preparation (MSP, ref. Inversion) treatments including application of seedling surroundings with glyphosate (Herbicide). MVC = mechanical vegetation control, DitchM = ditch mounding, SpotM = spot mounding. | ||||||
| Predictors | Pieksämäki Ln(height) | Suonenjoki Ln(height) | ||||
| Estimates | std. Error | p-values | Estimates | std. Error | p-values | |
| (Intercept) | –4.089 | 0.273 | <0.001 | –3.460 | 0.189 | <0.001 |
| MSP [DitchM] | –1.380 | 0.344 | <0.001 | –0.603 | 0.207 | 0.004 |
| MSP [SpotM] | –0.842 | 0.335 | 0.012 | –0.079 | 0.207 | 0.704 |
| MSP [Herbicide] | 1.462 | 0.405 | <0.001 | |||
| MSP [DitchMCTRL] | –0.620 | 0.390 | 0.112 | |||
| MSP [SpotMCTRL] | 0.033 | 0.486 | 0.946 | |||
| MSP [InversionCTRL] | 0.012 | 0.351 | 0.972 | 0.411 | 0.284 | 0.148 |
| MSP [HerbicideCTRL] | 0.928 | 0.341 | 0.006 | |||
| MVC | 0.440 | 0.247 | 0.076 | –0.067 | 0.204 | 0.744 |
| Ln(Age+9) | 3.172 | 0.097 | <0.001 | 3.115 | 0.068 | <0.001 |
| MSP [DitchM] × MVC | –0.100 | 0.333 | 0.764 | 0.488 | 0.256 | 0.057 |
| MSP [SpotM] × MVC | 0.078 | 0.329 | 0.813 | –0.130 | 0.258 | 0.616 |
| MSP [Herbicide] × MVC | –1.351 | 0.409 | 0.001 | |||
| MSP [DitchMCTRL] × MVC | 0.416 | 0.460 | 0.366 | |||
| MSP [SpotMCTRL] × MVC | –0.407 | 0.495 | 0.410 | |||
| MSP [InversionCTRL] × MVC | 0.010 | 0.358 | 0.978 | –0.312 | 0.389 | 0.423 |
| MSP [HerbicideCTRL] × MVC | –1.889 | 0.422 | <0.001 | |||
| MSP [DitchM] × Ln(Age+9) | 0.623 | 0.121 | <0.001 | 0.246 | 0.074 | 0.001 |
| MSP [SpotM] × Ln(Age+9) | 0.413 | 0.118 | <0.001 | 0.025 | 0.074 | 0.739 |
| MSP [Herbicide] × Ln(Age+9) | –0.730 | 0.145 | <0.001 | |||
| MSP [DitchMCTRL] × Ln(Age+9) | 0.206 | 0.139 | 0.138 | |||
| MSP [SpotMCTRL] × Ln(Age+9) | 0.034 | 0.171 | 0.844 | |||
| MSP [InversionCTRL] × Ln(Age+9) | –0.040 | 0.124 | 0.748 | –0.196 | 0.101 | 0.052 |
| MSP [HerbicideCTRL] × Ln(Age+9) | –0.433 | 0.120 | <0.001 | |||
| MVC × Ln(Age+9) | –0.183 | 0.086 | 0.034 | 0.003 | 0.072 | 0.964 |
| (MSP [DitchM] × MVC ) × Ln(Age+9) | 0.019 | 0.116 | 0.868 | –0.184 | 0.091 | 0.044 |
| (MSP [SpotM] × MVC ) × Ln(Age+9) | –0.034 | 0.115 | 0.767 | 0.095 | 0.092 | 0.300 |
| (MSP [Herbicide] × MVC ) × Ln(Age+9) | 0.618 | 0.146 | <0.001 | |||
| (MSP [DitchMCTRL] × MVC ) × Ln(Age+9) | –0.102 | 0.163 | 0.530 | |||
| (MSP [SpotMCTRL] × MVC ) × Ln(Age+9) | 0.186 | 0.173 | 0.281 | |||
| (MSP [InversionCTRL] × MVC ) × Ln(Age+9) | 0.083 | 0.126 | 0.512 | 0.217 | 0.137 | 0.114 |
| (MSP [HerbicideCTRL] × MVC ) × Ln(Age+9) | 0.822 | 0.149 | <0.001 | |||
| Random Effects | ||||||
| σ2 | 0.042 | 0.031 | ||||
| τ00 | 0.011 Block:MSP:Age_f | 0.003 Block:Sub_block:MSP:MVC:Age_f | ||||
| 0.069 Tree | 0.035 Tree | |||||
| 0.006 Block:Age_f | 0.002 Block:MSP:Age_f | |||||
| 0.014 Block:MSP | 0.005 Block:Age_f | |||||
| 0.001 Block | 0.000 Block:MSP | |||||
| 0.001 Block:Sub_block | ||||||
| 0.000 Block | ||||||
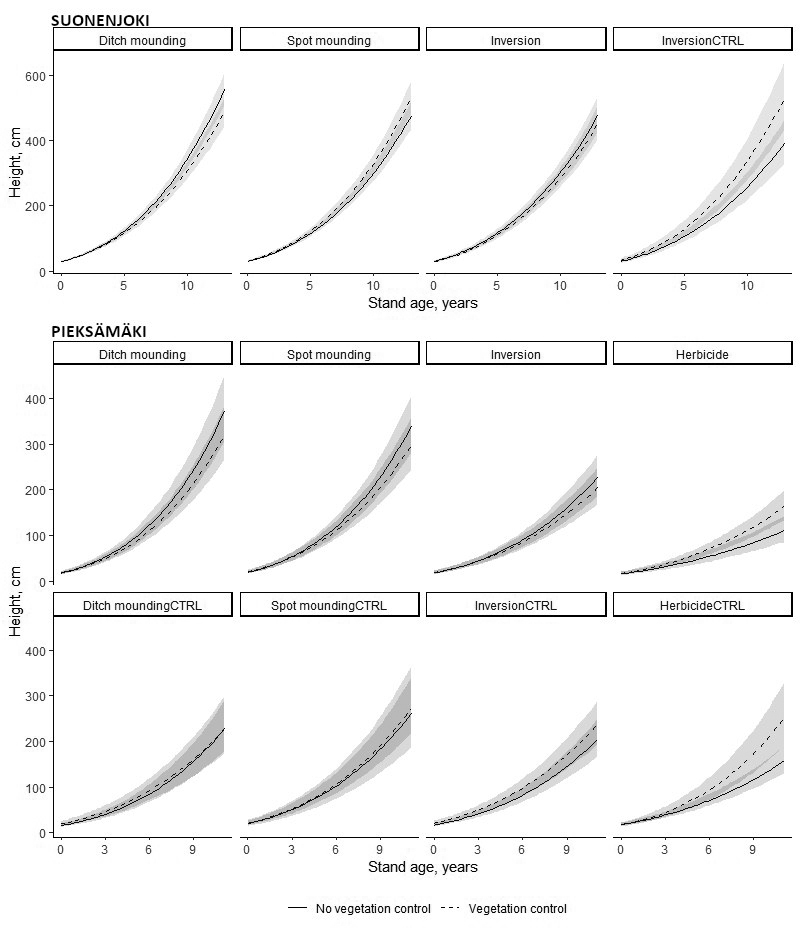
Fig. 3. Height development of spruce saplings in south-boreal forest in Finland at the Suonenjoki and Pieksämäki sites, respectively during the first 13 and 11 years after establishment according to site preparation and mechanical vegetation control (MVC) treatments. Lines represent the estimated median of the population and the transparent grey ribbon ±95%CI. When the ribbons are darker grey, CIs between MVC treatments overlaps each other. CTRL refers to control saplings planted in unprepared soil between the saplings planted on prepared soil.
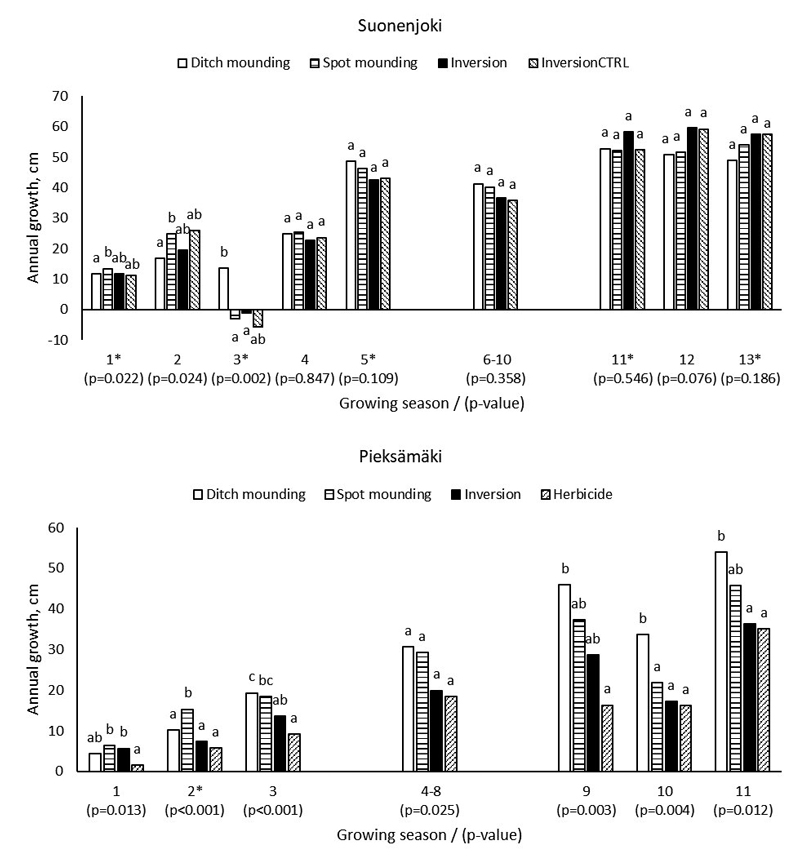
Fig. 4. The annual height growth of planted spruce saplings in south-boreal forest in Finland at the Suonenjoki and Pieksämäki sites in different growing seasons. The letters (a, b, c) represent significant differences in the Tukey HSD test at a confidence level of 95% within a single group of bars. (* variation of random factors on the main plot level was small and the random effect in the analyses had singular fit, which may affect reliability of p-values).
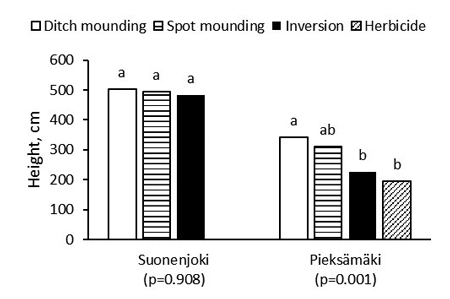
Fig. 5. The mean height of spruce saplings 13 and 11 years after establishment respectively at the Suonenjoki and Pieksämäki sites in south-boreal forest in Finland. The letters (a, b) represent significant differences in the Tukey HSD test results at a confidence level of 95% within one site.
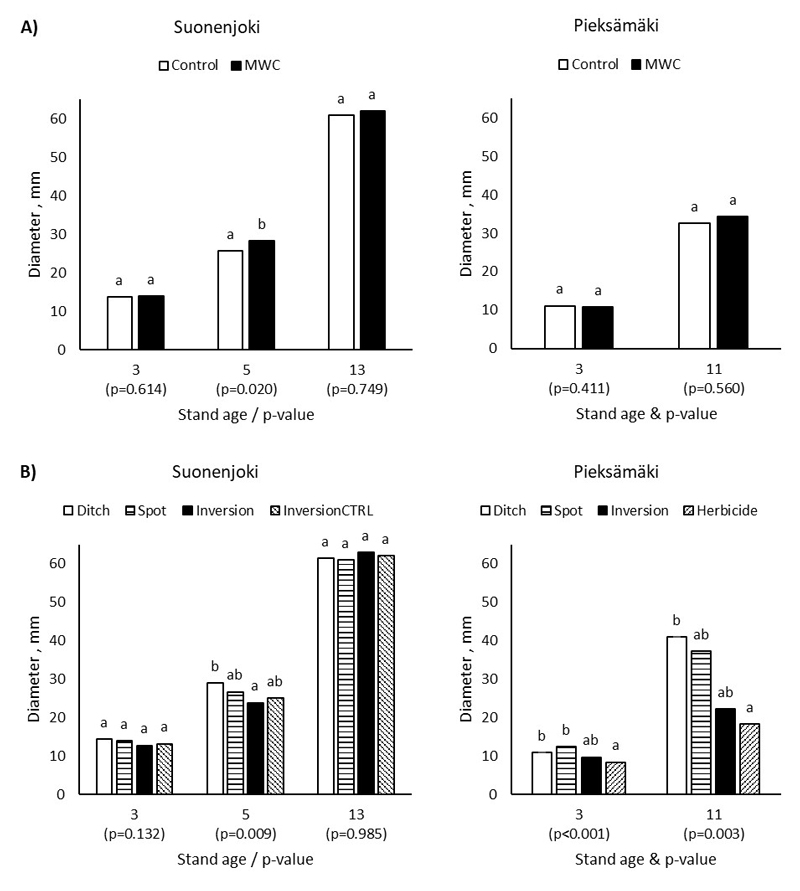
Fig. 6. The mean collar diameter of spruce saplings in 3- or 5-year-old stands or the mean diameter at breast height in 11- or 13-year- old stands in south-boreal forest in Finland at the Suonenjoki and Pieksämäki sites according to A) mechanical vegetation control (MWC) or B) site preparation treatments. The letters (a, b) represent significant differences in the Tukey HSD test at a confidence level of 95% within one age category. Inversion/CTRL are control saplings on inversion plots.
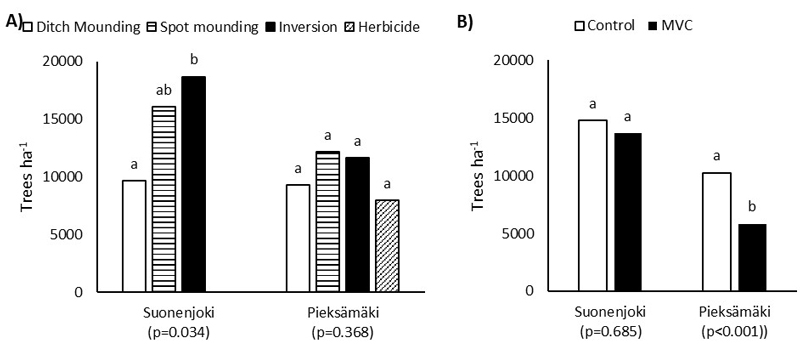
Fig. 7. The density of the resprouts in south-boreal forest in Finland at the age of 11 at Pieksämäki and at the age of 13 at Suonenjoki for those saplings that had undergone A) site preparation and B) mechanical vegetation control treatments (MVC). The letters (a, b) represent significant differences within site in the Tukey HSD test at a confidence level of 95%.