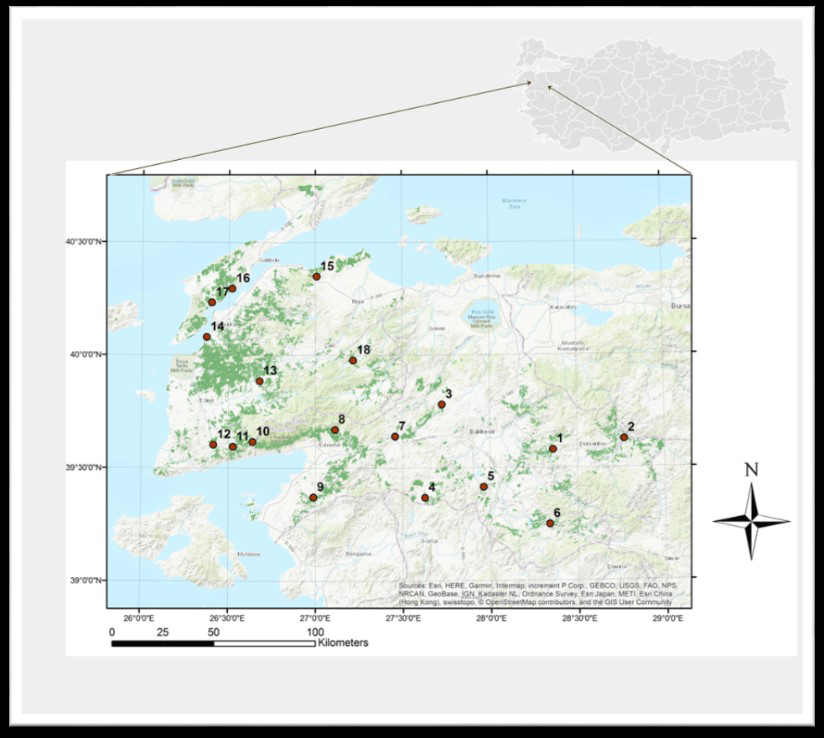
Fig. 1. Map of Southern Marmara, Türkiye, showing study sites denoted by 1–18 (with the distribution area of Turkish pine shown in dark green).
| Table 1. Geolocation of study sites where wood traps were established in Southern Marmara, Türkiye. | |||||
| Study site | Geographical position | Elevation (m) | Study site | Geographical position | Elevation (m) |
| 1. Kireç | 39°34’46.6”N 28°21’42.1”E | 508 | 10. Küçükkuyu | 39°37’02.6”N 26°38’19.3”E | 557 |
| 2. Gökçedağ | 39°37’29.5”N 28°46’12.2”E | 467 | 11. Yeniçam | 39°35’43.2”N 26°31’35.2”E | 379 |
| 3. Balya | 39°46’52.1”N 27°43’33.5”E | 448 | 12. Ayvacık | 39°36’14.7”N 26°24’52.80”E | 269 |
| 4. Savaştepe | 39°22’07.0”N 27°37’34.9”E | 275 | 13. Bayramiç | 39°53’11.2”N 26°40’44.9”E | 204 |
| 5. Konakpınar | 39°24’57.7”N 27°57’44.8”E | 442 | 14. Çınarlı | 40°4’53.6”N 26°22’24.9”E | 43 |
| 6. Sınıdırgı | 39°14’58.3”N 28°20’17.4”E | 321 | 15. Dişbudak | 40°20’59.8”N 27°00’24.3”E | 133 |
| 7. İvrindi | 39°38’26.2”N 27°27’25.7”E | 310 | 16. Gelibolu | 40°17’45.3”N 26°31’11.8”E | 26 |
| 8. Edremit | 39°40’15.3”N 27°06’43.5”E | 372 | 17. Eceabat | 40°14’04.0”N 26°24’10.9”E | 107 |
| 9. Burhaniye | 39°22’19.5”N 26°59’19.8”E | 311 | 18. Yenice | 39°58’41.6”N 27°13’0.6”E | 380 |
| Table 2. Representative fungal isolates of Ophiostomatoid fungi associated with Orthotomicus erosus on Pinus brutia during the current study. | |||||||
| Taxon | Isolate name | Study site | GenBank accession no. | Close match in BLAST | Accessison of match | Identity % | |
| LSU | ITS | ||||||
| Ceratocystis ips | CZ27.52 | 18 | - | OM867517 | Ophiostoma ips* | OM468593 | 99.7 |
| CZ51.1 | 1 | - | OM867518 | O. ips | OM468597 | 99.7 | |
| CZ24.21 | 15 | - | OM867519 | O. ips | OM468593 | 99.7 | |
| CZ30.21 | 4 | - | OM867520 | O. ips | OM468597 | 100 | |
| Graphilbum sp. | CZ20.19 | 11 | OM883868 | - | Graphilbum rectanglosporium | OM514754 | 99.1 |
| CZ30.6 | 4 | OM883867 | - | G. rectanglosporium | OM514754 | 99.1 | |
| CZ30.24 | 4 | - | - | - | - | - | |
| CZ44.9 | 17 | - | - | - | - | - | |
| Leptographium wingfieldii | CZ33.40 | 7 | - | OM885001 | Leptographium wingfieldii | KP691916 | 99.7 |
| CZ41.7 | 14 | - | OM885002 | L. wing.fieldii | KP691916 | 100 | |
| CZ40.25 | 13 | - | OM885003 | L. wing.fieldii | KP691916 | 100 | |
| CZ42.32 | 15 | - | OM885004 | L. wing.fieldii | KP691916 | 100 | |
| * Ophiostoma ips (syn. for Ceratocystis ips). | |||||||
| Table 3. List of reference sequences used for the phylogenetic tree in this study and their GenBank accesion. | |||||||
| Species name | Isolate number | Type1 | Isolated from | Country2 | Collector | GenBank accession numbers3 | |
| LSU | ITS | ||||||
| Ceratocystiopsis manitobensis | UM237 | T | P. resinosa/Manitoba beetle gallery | CAN | J. Reid | EU913674 | |
| Graphilbum anningense | CXY1939 | P. yunnanensis/T. yunnanensis | CHN | H.M. Wang | MH325162 | ||
| G. cf. rectangulosporium | VPRI43763 | P. radiata | AUS | A.J. Carnegie | MW046118 | ||
| G. cf. rectangulosporium | VPRI43843 | P. taeda | AUS | C. Trollip | MW046119 | ||
| G. crescericum | CMW22828 | T | P. radiata/H. palliatus | ESP | P. Romón | OM514749 | |
| G. fragrans | CBS 279.54 | T | SWE | A. Mathiesen-Kaeaerik | MH868872 | ||
| G. fragrans | CBS 279.54 | P. sylvestris | SWE | T.C. Harrington | AF198248 | ||
| G. ipis-grandicollis | VPRI43762 | T | Pinus radiata/I. grandicollis | AUS | A.J. Carnegie | MW046117 | |
| G. rectangulosporium | CMW26258 | M. Procter | OM514754 | ||||
| Grosmannia aurea | CMW667 | A | Pinus contorta var. latifolia | CAN | R.W. Davidson | OM501387 | |
| Leptographium longiclavatum | SL-Kw1436 | CAN | AY816686 | ||||
| L. lundbergii | CMW2190 | T | P. sylvestris | NOR | H. Roll-Hansen | OM501432 | |
| L. pyrinum | CMW509 | T | D. adjunctus | USA | K.R.W. Davidson J. | OM501445 | |
| L. terebrantis | CMW29841 | T | D. terebrantis | USA | S.J. Baras | JF798477 | |
| L. wingfieldii | CBS 645.89 | E | T. piniperda | FRA | M. Morelet | AY935603 | |
| L. wingfieldii | MB192 | P. halepensis/T. destruens gallery | ISR | M. Dori-Bachash | KP691916 | ||
| L. wingfieldii | CMW4741 | P. densiflora | JPN | H. Masuya | OM501461 | ||
| L. wingfieldii | CBS 648.89 | E | P. brutia | GRC | Mich.-Ska. | AY935611 | |
| L. wingfieldii | MCC 125 | P. densiflora | JPN | M. Masuya | AY935608 | ||
| L. wingfieldii | CMW2096 | P. strobus /T. piniperda | EUR | M. Morelet | AY553398 | ||
| L. wingfieldii | CMW2096 | T | FRA | FIN | AY553398 | ||
| Ophiostoma bicolor | CBS492.77 | T | Picea glauca | CAN | S.M. Alamouti | DQ268604 | |
| O. floccosum | CMW34182 | T | Wood | SWE | A. Mathiesen-Käärik | KU184431 | |
| O. fuscum | CMW23196 | T | Picea abies/P. chalcographus | FIN | Linnakoski | HM031504 | |
| O. ips | AK188 | Ips acuminatus | UKR | K.V. Davydenko | KU663983 | ||
| O. ips | CMW7075 | T | I. i̇nteger | USA | CT Rumbold | AY546704 | |
| O. ips | MB176 | P. halepensis/O. erosus | ISR | Dori-Bachash | KP691908 | ||
| O. ips | CMW6418 | P. elliottii/O. erosus | ZAF | XD Zhou | AY546702 | ||
| O. ips | S36.9 | Pine wood | PRT | C.S. Vicente | OM468593 | ||
| O. ips | S40.1a | P. pinaster | PRT | C.S. Vicente | OM468597 | ||
| O. ips | MCC 023 | Tp beetle | JPN | H. Masuya | AY194935 | ||
| O. japonicum | CMW2202 | T | I. typographus japonicus/Picea jezoensis | JPN | Y. Yamaoka | OM501492 | |
| O. montium | CMW15419 | P. contorta | USA | B. Bentz | OM501498 | ||
| O. piceae | C1087 | T | DEU | Münch | AF198226 | ||
| O. pseudobicolor | CFCC52683 | T | I. subelongatus/Larix gmelinii | CHN | Q. Lu | MK748188 | |
| O. quercus | CMW2467 | T | Quercus spp. | FRA | M. Morelet | AY466626 | |
| O. rectangulosporium | MAFF 238951 | JPN | N. Ohtaka | AB235158 | |||
| 1 T = ex-type, E = ex-epitype, A = authentic isolate. 2 AUS: Australia, CAN: Canada, CHN: China, DEU: Germany, ESP: Spain, EUR: Europe, FIN: Finland, FRA: France, GRC: Greece, ISR: Israel, JPN: Japan, NOR: Norway, PRT: Portugal, SWE: Sweden, UKR: Ukraine, USA: United States of America, ZAF: South Africa. 3 ITS: internal transcribed spacer, LSU: ribosomal large subunit. | |||||||
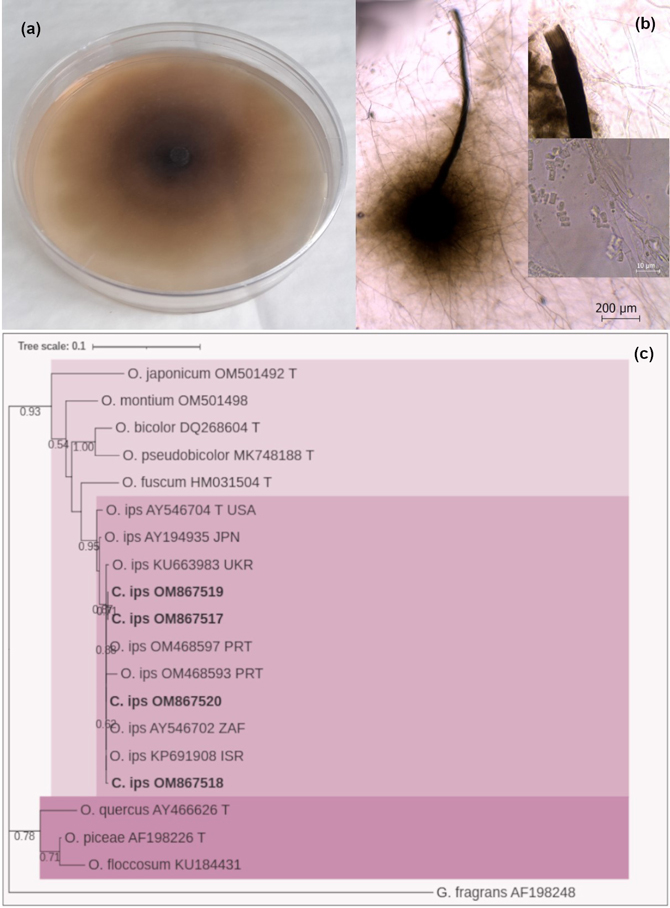
Fig. 2. (a) Colony characteristics of Ceratocystis ips on 2% MEA, 25 ℃ for 10 d: (b) light microscopic micrographs; peritechia, ostium and ascospores of C. ips, (c) phylogenetic estimate, based on the ITS and 5.8S regions of the nuclear rRNA operon sequence analysis, showing potential phylogenetic relationships. The tree is rooted in Graphilbum fragrans. The tree was constructed with the MEGA program and evaluated using the bootstrap procedure (1000 replicates). Only bootstrap values >50% were provided. The analysis involved 20 nucleotide sequences. There were 1354 positions in the final dataset. The isolates obtained in this study are shown in bold.
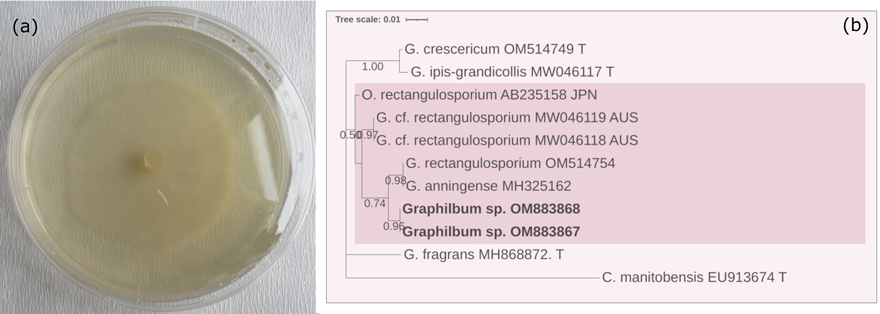
Fig. 3. (a) Colony characteristics of Graphilbum sp. grown on 2% MEA, 25 ℃ for 10 d. (b) Based on the LSU sequence analysis, a phylogenetic estimate showed potential phylogenetic relationships. The tree was constructed with the MEGA program and evaluated using the bootstrap procedure (1000 replicates). Only bootstrap values >50% were provided. This analysis included 11 nucleotide sequences. There were 896 positions in the final dataset. The isolates obtained from this study were printed in bold.
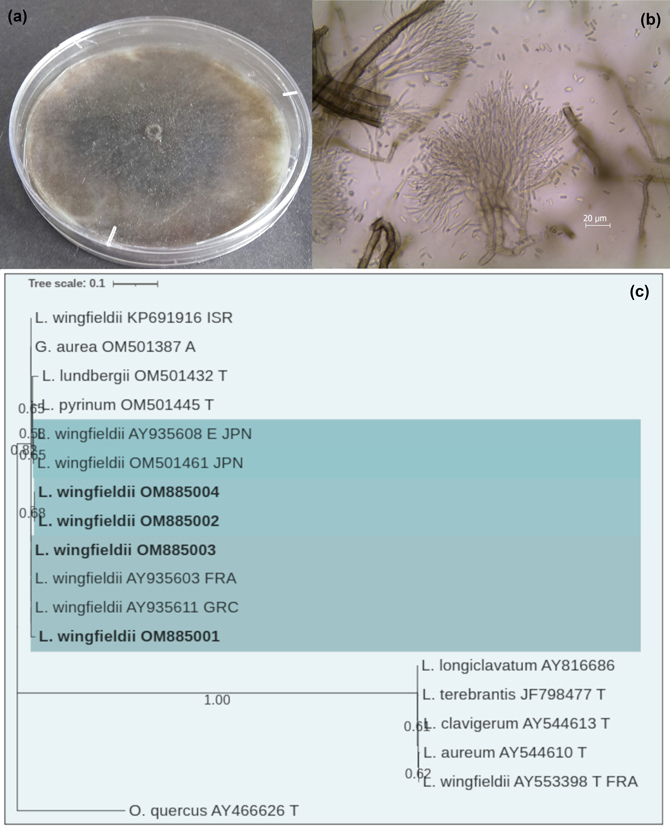
Fig. 4. (a) Colony characteristics of Leptographium wingfieldii grown on 2% MEA, 25 ℃ for 10 d. (b) Light microscopic micrographs: conidiophores and conidia of L. wingfieldii, (c) Phylogenetic estimate based on the ITS and 5.8S regions of the nuclear rRNA operon sequence analysis, showing the potential phylogenetic relationships. The tree is rooted in O. quercus. The tree was constructed with the MEGA program and evaluated using the bootstrap procedure (1000 replicates). Only bootstrap values >50% were provided. This analysis involved 18 nucleotide sequences. There were 842 positions in the final dataset. The isolates obtained from this study were printed in bold.
| Table 4. Fungal species detected from Orthotomicus erosus adults, larvae, pupa and gallery (number of fungal isolates frequency) collected at all study sites. | ||||||
| Fungal Species | Study site/s | Gallery | Larvae/Pupae | Beetle | Total | % |
| Ceratocystis ips | 1,2,3,4,5,6,8,10,11,12,13,14,15,16,17,18 | 13 | 15 | 463 | 481 | 69 |
| Graphilbum sp. | 1,2,3,4,6,11,12,13,15,17 | 2 | - | 24 | 26 | 4 |
| Leptographium wingfieldii | 1,2,3,4,5,6,7,10,13,14,15 | 8 | 2 | 177 | 187 | 27 |
| Table 5. Length (and standard error) of the lesion in phloem in branches of Turkish pine 4 months after inoculation with Ophiostomatoid spp. | ||||||
| Species | Isolate no. | Tree no. | Mean lesion length (mm) | Re-isolation % | ||
| 1th tree | 2nd tree | Total | ||||
| Ceratocystis ips | CZ24.21 | 1b/2a | 52 ± 27.1 | 15.8 ± 4.9 | 33.9a ± 26.5 | 95.5 |
| CZ27.52 | 3c/4b | 67 ± 11.5 | 43.4 ± 6.8 | 55.2bc ± 15.3 | 86.4 | |
| CZ51.1 | 5a/6c | 55.8 ± 8.6 | 75.2 ± 30.5 | 65.5c ± 30.5 | 86.4 | |
| CZ30.21 | 7b/8b | 50.4 ± 9.9 | 51.8 ± 10.7 | 51.1bc ± 9.7 | 95.5 | |
| Total | 51.4 ± 24.2 | 91 | ||||
| Leptographium wingfieldii | CZ33.40 | 9b/10a | 63.8 ± 69.9 | 25 ± 11.1 | 44.4b ± 51.4 | 86.4 |
| CZ41.7 | 11b/12c | 48.2 ± 6.7 | 83.6 ± 22.9 | 65.9c ± 24.5 | 68.2 | |
| CZ40. 25 | 13a/14a | 33.6 ± 20.2 | 35.2 ± 5.8 | 34.4b ± 14.0 | 31.8 | |
| CZ42.32 | 15a/16b | 24 ± 15.1 | 44.6 ± 19.6 | 34.3b ± 19.8 | 68.2 | |
| Total | 44.8 ± 32.3 | 64 | ||||
| Graphilbum sp. | CZ20.19 | 17b/18a | 43.6 ± 9.5 | 28.6 ± 12.2 | 36.1b ± 13.0 | 77.3 |
| CZ30.6 | 19a/20a | 40.6 ± 14.2 | 21.4 ± 5.3 | 31.0a ± 14.3 | 40.9 | |
| CZ30.24 | 21a/22a | 30.6 ± 13.9 | 28.4 ± 13.8 | 29.5a ± 13.1 | 4.5 | |
| CZ44.9 | 23a/24a | 31.8 ± 3.4 | 26.6 ± 9.3 | 29.2a ± 7.2 | 86.4 | |
| Total | 31.5 ± 12.1 | 52 | ||||
| Control | 25a – 32a | 25.3a ± 7.7 | ||||
| Lesion length data were transformed (log10) before analysis though non-transformed values were reported. The same letters within the columns are not significantly different from one another at p < 0.0001 | ||||||