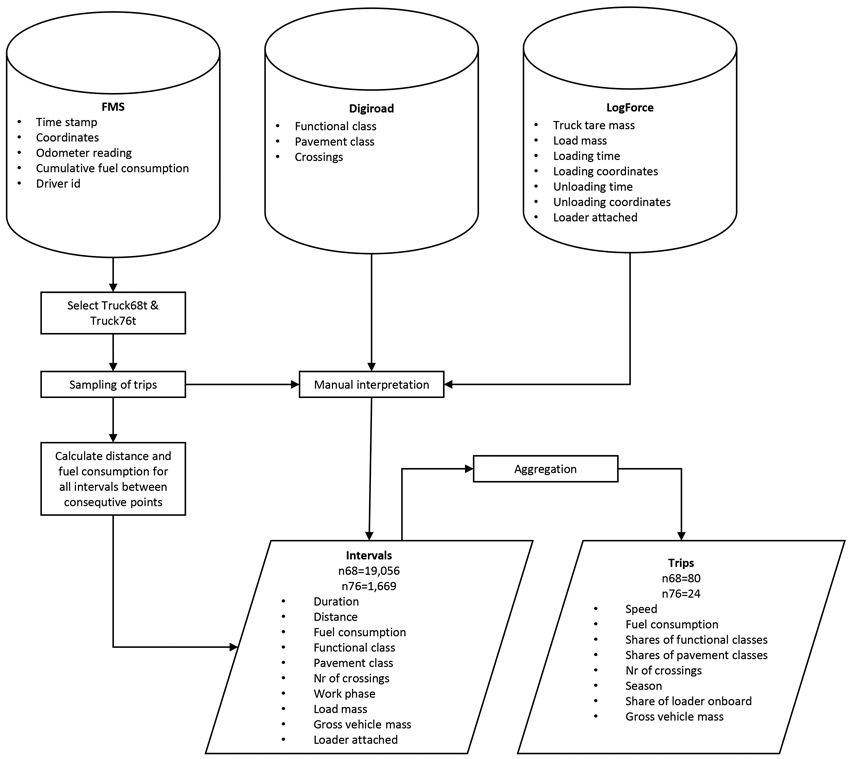
Fig. 1. The procedure to collect trip-level data for modelling of speed and fuel consumption of timber trucks. FMS is the database of a fleet management system, Digiroad the national street and road database, and LogForce the database of a transport management system. The relevant attributes are listed. Truck68t refers to the 68-tonne truck and Truck76t to the 76-tonne truck. n68 and n76 refer to the number of observations of the corresponding trucks.
| Table 1. Basic information of the timber trucks. The notation “*4” indicates the second steered axle was located behind the driven tandem. |
| Combination vehicle | Straight truck | Full trailer |
| Id | Gross vehicle mass (t) | Nominal tracking interval (min) | Brand and model | Axle configuration | Commissioned in | Engine displacement (cm3) | Output (kW) | Tare mass (kg) | Loader mass (kg) | Brand and model | Tare mass (kg) |
| Truck68t | 68 | 1 | Scania
R 560 | 6×4 | 2013 | 15 607 | 412 | 11 750 | 3500 | Feber Intercars
42P0D6 | 8250 |
| Truck76t | 76 | 10 | Scania
R 580 | 8×4*4 | 2017 | 16 353 | 427 | 13 100 | 3800 | Närko
D4HS11T11 | 8500 |
| Table 2. Work phase division of timber trucking for the estimation of truck speed and fuel consumption (adapted from Nurminen and Heinonen 2007). |
| Work phase | Definition |
| Driving without load | Begins when the truck leaves the mill storage area after unloading and ends when the truck stops at a roadside storage to receive a new load. |
| Loading | Begins when the truck stops at a roadside storage and ends when the truck leaves for the mill or for travel to the next roadside storage. In addition to actual loading, includes auxiliary activities like preparing the crane, driving between piles, handling the trailer and bunks, and binding the load. |
| Driving between roadside storages | Begins when the truck leaves one roadside storage and ends when the truck stops at the next. |
| Driving with load | Begins when the truck leaves the last roadside storage and ends when the truck stops at a mill yard. |
| Unloading | Begins when the truck arrives at a mill yard and ends when the truck leaves without a load. In addition to actual unloading, includes queueing and waiting, and auxiliary activities like preparations, scaling, and driving between unloading locations. |
| Other driving | Begins when the truck turns off the route and ends when the truck is back on the route. The minimum time for other driving was set at 2 h. |
| Break, max 15 min | Begins when the truck stops for a break of at most 15 minutes and ends when the truck continues driving. |
| Break, over 15 min | Begins when the truck stops for a break of more than 15 minutes and ends when the truck continues driving. |
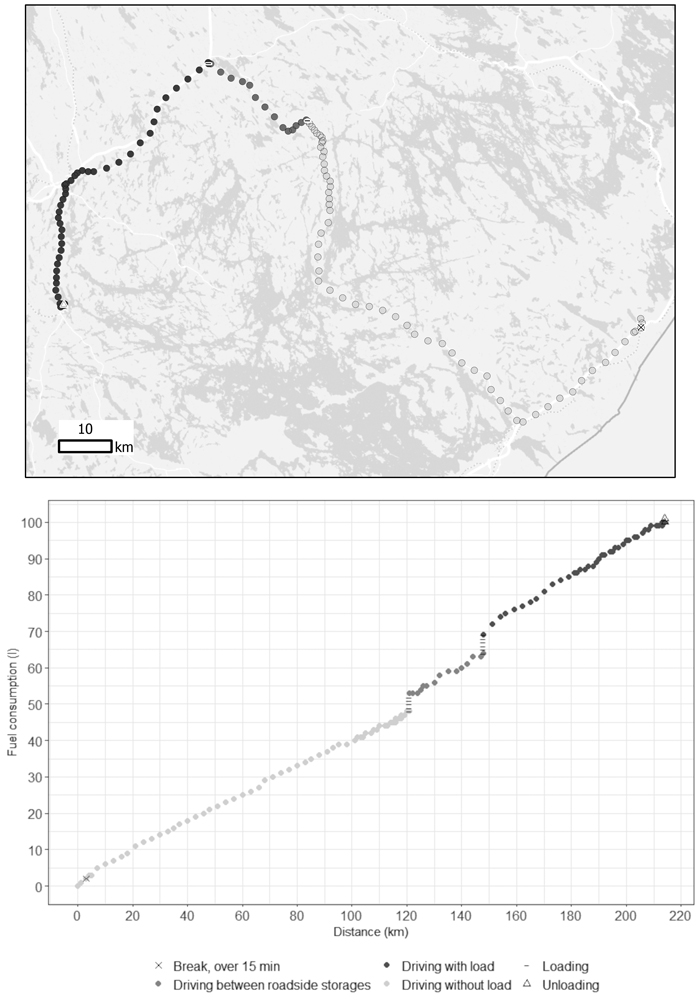
Fig. 2. An example of the interpreted work phases of a trip (above) and the corresponding fuel consumption as a function of driving distance of a timber truck (below).
| Table 3. Road classes in Digiroad (Finnish Transport Infrastructure Agency 2018) and their reclassification for regression analysis of driving speed and fuel consumption. |
| Road class | Reclassification |
| Class I main road | Main road |
| Class II main road | Main road |
| Regional road | Main road |
| Connecting road | Collector road |
| Class I private road | Collector road |
| Unknown road class | Collector road |
| Class II private road | Forest road |
| Vehicle track | Forest road |
| N/A | Forest road |
| Table 4. Pavement classes in Digiroad (Finnish Transport Infrastructure Agency 2018) and their reclassification for regression analysis of driving speed and fuel consumption. |
| Pavement class | Reclassification |
| Hard asphalt concrete | Asphalt |
| Soft asphalt concrete | Asphalt |
| Gravel surface | Gravel |
| Gravel wear layer | Gravel |
| Paved, type unknown | Gravel |
| No pavement | No pavement |
| Table 5. Summary of the examined trips for the 68-tonne and 76-tonne trucks. |
| Truck68t | Truck76t |
| Number of trips | 80 | 24 |
| Average trip distance (km) | 203 | 160 |
| Minimum trip distance (km) | 23 | 60 |
| Maximum trip distance (km) | 385 | 335 |
| Average load (t) | 49.5 | 49.3 |
| Minimum load (t) | 35 | 36.1 |
| Maximum load (t) | 54.1 | 57.7 |
| Number of crossings | 1888 | 490 |
| Total time consumption (h) | 578 | 135 |
| Total fuel consumption (l) | 9279 | 2546 |
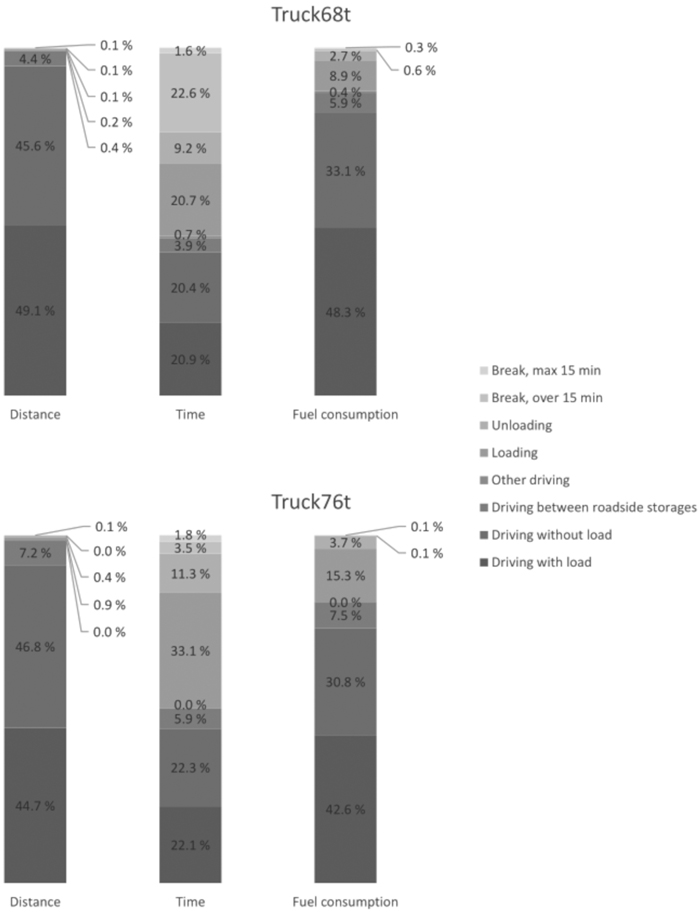
Fig. 3. Distribution of driving distance, driving time, and fuel consumption for the 68-tonne and 76-tonne timber trucks.
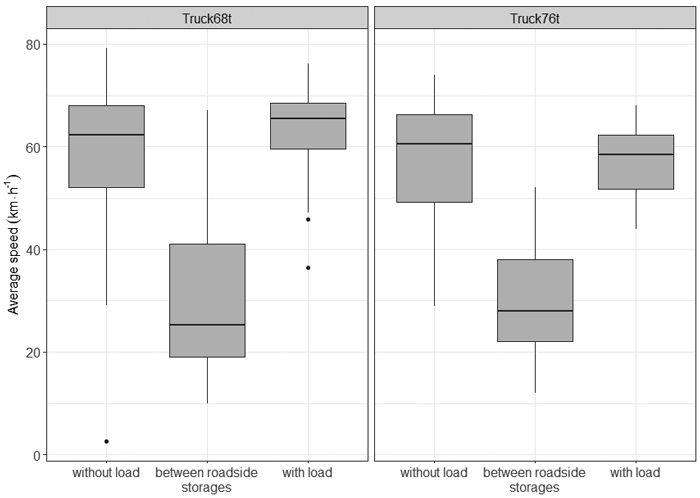
Fig. 4. Distribution of trip-level average truck speed of driving work phases for the 68-tonne and 76-tonne timber trucks.
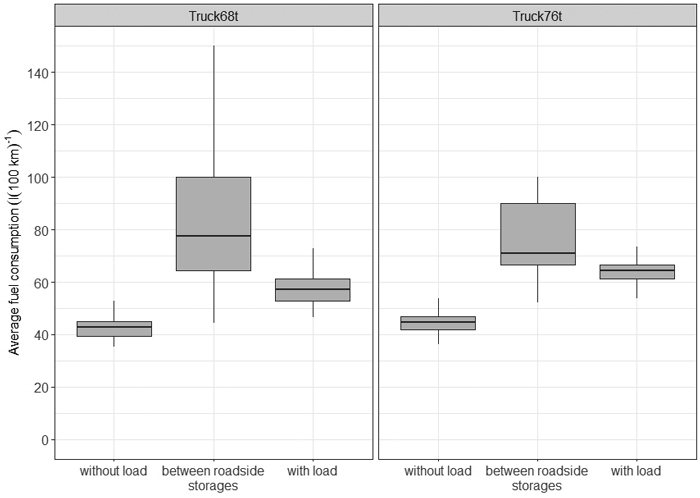
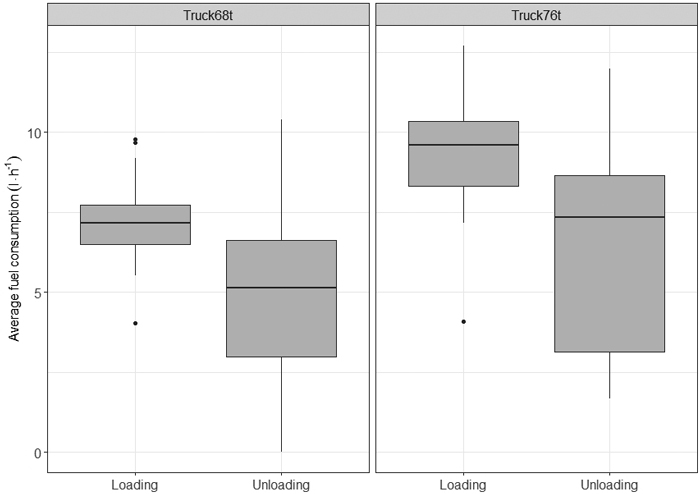
Fig. 5. Distribution of trip-level fuel consumption of driving work phases for the 68-tonne and 76-tonne timber trucks.
Fig. 6. Distribution of trip-level fuel consumption of non-driving work phases for the 68-tonne and 76-tonne timber trucks.
| Table 6. Total distances (km) in functional and pavement classes for the 68-tonne and 76-tonne trucks. |
| | Hard asphalt concrete | Soft asphalt concrete | Gravel surface | Gravel wear layer | Paved, type unknown | Unpaved | Total |
| Truck68t | Class I main road | 9465 | 0 | 0 | 0 | 11 | 0 | 9476 |
| Class II main road | 2567 | 857 | 0 | 0 | 0 | 2 | 3426 |
| Regional road | 258 | 494 | 0 | 0 | 50 | 0 | 802 |
| Connecting road | 108 | 723 | 8 | 568 | 146 | 2 | 1555 |
| Class I private road | 1 | 0 | 0 | 0 | 29 | 0 | 30 |
| Class II private road | 0 | 0 | 0 | 3 | 72 | 745 | 820 |
| Vehicle track | 0 | 0 | 0 | 0 | 0 | 12 | 12 |
| No data | 0 | 0 | 0 | 0 | 2 | 10 | 12 |
| Total | 12 399 | 2074 | 8 | 571 | 310 | 771 | 16 133 |
| Truck76t | Class I main road | 1368 | 0 | 0 | 0 | 0 | 0 | 1368 |
| Class II main road | 1493 | 0 | 0 | 0 | 0 | 0 | 1493 |
| Regional road | 337 | 89 | 0 | 0 | 0 | 0 | 426 |
| Connecting road | 25 | 182 | 0 | 59 | 82 | 0 | 348 |
| Class I private road | 0 | 0 | 0 | 0 | 17 | 7 | 24 |
| Class II private road | 0 | 0 | 0 | 0 | 0 | 105 | 105 |
| Vehicle track | 0 | 0 | 0 | 0 | 0 | 19 | 19 |
| No data | 0 | 0 | 0 | 0 | 0 | 7 | 7 |
| Total | 3223 | 271 | 0 | 59 | 99 | 138 | 3790 |
| Table 7. Average speed (km h–1) in functional and pavement classes for the 68-tonne and 76-tonne trucks. For comparison, the values in ESRI Finland’s (2019) data set are given. The darkness of cell shading indicates speed. |
| | Hard asphalt concrete | Soft asphalt concrete | Gravel surface | Gravel wear layer | Paved, type unknown | Unpaved | Average | ESRI Finland |
| Truck68t | Class I main road | 76 | | | | 40 | | 76 | 80 |
| Class II main road | 76 | 71 | | | | | 75 | 76 |
| Regional road | 51 | 70 | | | 28 | | 58 | 65 |
| Connecting road | 35 | 52 | 48 | 45 | 33 | 40 | 45 | 48 |
| Class I private road | | | | | 10 | | 10 | 40 |
| Class II private road | | | | 60 | 32 | 20 | 21 | 30 |
| Vehicle track | | | | | | 9 | 9 | 20 |
| No data | | | | | | 4 | 4 | |
| Average | 74 | 63 | 48 | 45 | 26 | 19 | 61 | |
| Truck76t | Class I main road | 69 | | | | | | 69 | 80 |
| Class II main road | 70 | | | | | | 70 | 76 |
| Regional road | 60 | 46 | | | | | 56 | 65 |
| Connecting road | 38 | 45 | | 40 | 28 | | 38 | 48 |
| Class I private road | | | | | 15 | | 12 | 40 |
| Class II private road | | | | | | 17 | 17 | 30 |
| Vehicle track | | | | | | 10 | 10 | 20 |
| No data | | | | | | 13 | 13 | |
| Average | 68 | 46 | | 40 | 24 | 14 | 56 | |
| Table 8. Average fuel consumption (l(100 km)–1) in functional and pavement classes for the 68-tonne and 76-tonne trucks. The darkness of cell shading indicates fuel consumption. |
| | Hard asphalt concrete | Soft asphalt concrete | Gravel surface | Gravel wear layer | Paved, type unknown | Unpaved | Average |
| Truck68t | Class I main road | 47 | | | | 82 | | 47 |
| Class II main road | 48 | 48 | | | | | 48 |
| Regional road | 49 | 47 | | | 54 | | 48 |
| Connecting road | 58 | 54 | 88 | 63 | 59 | 50 | 59 |
| Class I private road | | | | | 62 | | 62 |
| Class II private road | | | | 67 | 67 | 82 | 81 |
| Vehicle track | | | | | | 133 | 133 |
| No data | | | | | | 90 | 81 |
| Average | 48 | 50 | 88 | 63 | 62 | 83 | 50 |
| Truck76t | Class I main road | 51 | | | | | | 51 |
| Class II main road | 53 | | | | | | 53 |
| Regional road | 58 | 52 | | | | | 57 |
| Connecting road | 60 | 59 | | 58 | 59 | | 59 |
| Class I private road | | | | | 82 | | 61 |
| Class II private road | | | | | | 83 | 83 |
| Vehicle track | | | | | | 111 | 111 |
| No data | | | | | | 86 | 86 |
| Average | 52 | 57 | | 58 | 64 | 84 | 54 |
| Table 9. Total driven kilometres by driver for the 68-tonne and 76-tonne timber trucks. |
| Truck | Driver | Total distance (km) |
| Truck68t | 1 | 7430 |
| Truck68t | 2 | 6829 |
| Truck68t | 3 | 1362 |
| Truck68t | 4 | 490 |
| Truck68t | 5 | 2 |
| Truck76t | 6 | 1900 |
| Truck76t | 7 | 1371 |
| Truck76t | 8 | 243 |
| Truck76t | 9 | 99 |
| Truck76t | 10 | 90 |
| Truck76t | 11 | 46 |
| Truck76t | 12 | 25 |
| Truck76t | 13 | 9 |
| Table 10. Statistics of the trip-level speed and fuel consumption models for a 68-tonne timber truck. The unit of RMSE of the speed models is km h–1 and of the fuel consumption models l(100 km)–1. |
| Model | n | RMSE | R2adj | F-test |
| Speed when driving without load | 79 | 4.3 | 0.84 | F(5,73) = 80.47, p < 0.001 |
| Speed when driving with load | 80 | 3.7 | 0.77 | F(6,73) = 43.96, p < 0.001 |
| Fuel consumption when driving without load | 79 | 2.6 | 0.52 | F(5,73) = 18.21, p < 0.001 |
| Fuel consumption when driving with load | 80 | 4.4 | 0.47 | F(6,73) = 12.71, p < 0.001 |
| Table 11. Parameter estimates and test statistics of the 68-tonne timber truck speed models for driving without a load. ForestRoad = proportion of forest roads when driving without a load; Gravel = proportion of poor asphalt and gravel roads when driving without a load; Crossings = number of road crossings when driving without a load ((100 km)–1); DecFeb = 1 if the transport date is within range [December, February], otherwise 0; MarMay = 1 if the transport date is within range [March, May], otherwise 0. |
| Term | Estimate | Std. error | t-test |
| Intercept | 77.3 | 1.1 | t(73) = 71.25, p < 0.001 |
| ForestRoad | –44.6 | 5.3 | t(73) = –8.44, p < 0.001 |
| Gravel | –31.4 | 7.4 | t(73) = –4.22, p < 0.001 |
| Crossings | –0.7 | 0.1 | t(73) = –12.51, p < 0.001 |
| DecFeb | –3.1 | 1.2 | t(73) = –2.56, p = 0.013 |
| MarMay | –3.4 | 1.2 | t(73) = –2.81, p = 0.006 |
| Table 12. Parameter estimates and test statistics of the 68-tonne timber truck speed models for driving with a load. ForestRoad = proportion of forest roads when driving with a load; Asphalt = proportion of hard and soft asphalt concrete when driving with a load; Crossings = number of road crossings when driving with a load ((100 km)–1); SepNov = 1 if the transport date is within range [September, November], otherwise 0; DecFeb = 1 if the transport date is within range [December, February], otherwise 0; MarMay = 1 if the transport date is within range [March, May], otherwise 0. |
| Term | Estimate | Std. error | t-test |
| Intercept | 36.0 | 6.3 | t(73) = 5.74, p < 0.001 |
| ForestRoad | –22.6 | 13.4 | t(73) = –1.69, p = 0.095 |
| Asphalt | 42.1 | 6.4 | t(73) = 6.57, p < 0.001 |
| Crossings | –0.8 | 0.1 | t(73) = –8.65, p < 0.001 |
| SepNov | –3.2 | 1.2 | t(73) = –2.67, p = 0.009 |
| DecFeb | –2.7 | 1.2 | t(73) = –2.26, p = 0.027 |
| MarMay | –2.8 | 1.2 | t(73) = –2.33, p = 0.023 |
| Table 13. Parameter estimates and test statistics of the 68-tonne timber truck fuel consumption models for driving without a load. ForestRoad = proportion of forest roads when driving without load; Loader = proportion of distance traveled with a loader when driving without load; Crossings = number of road crossings when driving without load ((100 km)–1); SepNov = 1 if the transport date is within range [September, November], otherwise 0; DecFeb = 1 if the transport date is within range [December, February], otherwise 0. |
| Term | Estimate | Std. error | t-test |
| Intercept | 38.0 | 0.9 | t(73) = 40.60, p < 0.001 |
| ForestRoad | 9.0 | 3.2 | t(73) = 2.83, p = 0.006 |
| Loader | 2.5 | 1.0 | t(73) = 2.38, p = 0.002 |
| Crossings | 0.1 | 0.0 | t(73) = 4.17, p < 0.001 |
| SepNov | –3.1 | 0.8 | t(73) = –4.15, p < 0.001 |
| DecFeb | 2.3 | 0.8 | t(73) = 3.074, p = 0.003 |
| Table 14. Parameter estimates and test statistics of the 68-tonne timber truck fuel consumption models for driving with a load. Asphalt = proportion of hard and soft asphalt concrete when driving with a load; Gravel = proportion of poor asphalt and gravel roads when driving with a load; Crossings = number of road crossings when driving with a load ((100 km)–1); Mass = Total mass of the truck (t); DecFeb = 1 if the transport date is within range [December, February], otherwise 0; MarMay = 1 if the transport date is within range [March, May], otherwise 0. |
| Term | Estimate | Std. error | t-test |
| Intercept | 86.7 | 17.4 | t(73) = 4.97, p < 0.001 |
| Asphalt | –54.1 | 12.7 | t(73) = –4.25, p < 0.001 |
| Gravel | –44.1 | 15.8 | t(73) = –2.80, p = 0.007 |
| Crossings | 0.4 | 0.1 | t(73) = 3.36, p = 0.001 |
| Mass1.1 | 0.2 | 0.1 | t(73) = 1.75, p = 0.084 |
| DecFeb | 2.9 | 1.2 | t(73) = 2.31, p = 0.023 |
| MarMay | 2.7 | 1.2 | t(73) = 2.26, p < 0.027 |