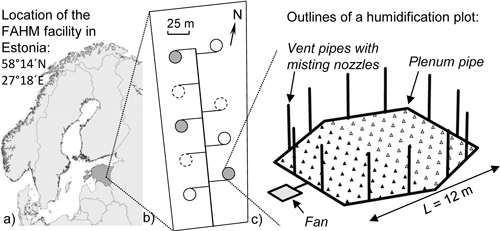
Fig. 1. a) Location of the FAHM facility, b) layout of the experimental area (empty circles are control plots, filled circles are humidification plots, empty circles with dashed outline are open-top plots not included in this study) and c) layout of the humidification plot (black triangles stand for hybrid aspens and empty triangles for silver birches).
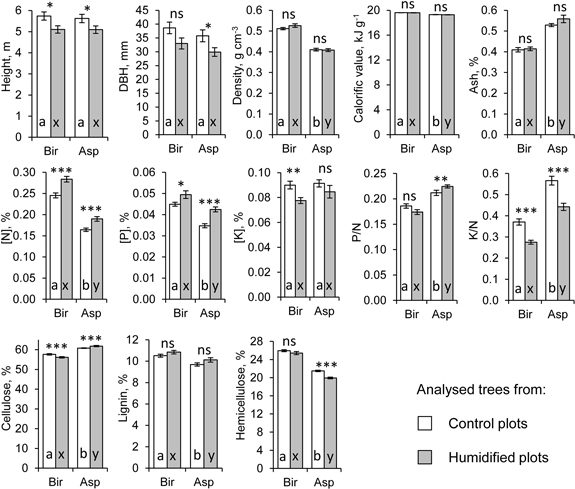
Fig. 2. Average growth and wood characteristics of the analysed silver birch (Bir) and hybrid aspen (Asp) sample trees (n = 91). Error bars show standard error, asterisks show the significance of treatment effect (p < 0.05*, p < 0.01**, p < 0.001***, ns: not significant) based on ANOVA model (Eq. 1), letters on the columns denote differences between tree species separately for control (a, b) and humidified plots (x, y).
| Table 1. Mean growth and wood characteristics of the analysed silver birch and hybrid aspen trees (n = 91) in control (C) and humidified (H) plots, factor effects based on ANOVA model (Eq. 1), superscript letters (a, b) denote significant differences between tree species within treatment according to t-test. | |||||||
| Characteristic | Tree species | Mean ± st. error | Factor effects | ||||
| Treatment | Plot(Treatment) | ||||||
| C plots | H plots | F | p | F | p | ||
| Height, m | Birch | 5.74 ± 0.19a | 5.10 ± 0.18a | 6.6 | 0.015 | 2.5 | 0.056 |
| Aspen | 5.62 ± 0.20a | 5.09 ± 0.18a | 4.3 | 0.044 | 2.3 | 0.077 | |
| DBH, mm | Birch | 38.6 ± 2.1a | 33.0 ± 2.0a | 3.6 | 0.066 | 0.9 | 0.483 |
| Aspen | 35.8 ± 2.1a | 29.9 ± 1.6a | 4.7 | 0.036 | 0.8 | 0.508 | |
| Cellulose, % | Birch | 57.6 ± 0.35a | 56.1 ± 0.34a | 13.2 | <0.001 | 5.6 | <0.001 |
| Aspen | 60.8 ± 0.15b | 61.8 ± 0.32b | 12.9 | <0.001 | 6.9 | <0.001 | |
| Lignin, % | Birch | 10.5 ± 0.14a | 10.8 ± 0.17a | 2.2 | 0.142 | 0.9 | 0.480 |
| Aspen | 9.7 ± 0.15b | 10.1 ± 0.21b | 3.0 | 0.089 | 2.7 | 0.045 | |
| Hemicellulose, % | Birch | 25.9 ± 0.21a | 25.4 ± 0.33a | 2.1 | 0.154 | 2.4 | 0.065 |
| Aspen | 21.5 ± 0.16b | 19.9 ± 0.19b | 42.3 | <0.001 | 1.8 | 0.150 | |
| [N], % | Birch | 0.25 ± 0.006a | 0.28 ± 0.007a | 20.9 | <0.001 | 2.6 | 0.052 |
| Aspen | 0.16 ± 0.004b | 0.19 ± 0.006b | 17.0 | <0.001 | 5.2 | 0.002 | |
| [P], % | Birch | 0.045 ± 0.001a | 0.049 ± 0.002a | 5.5 | 0.024 | 3.0 | 0.030 |
| Aspen | 0.035 ± 0.001b | 0.042 ± 0.001b | 32.1 | 0.000 | 3.7 | 0.012 | |
| [K], % | Birch | 0.090 ± 0.003a | 0.078 ± 0.002a | 10.4 | 0.003 | 1.5 | 0.215 |
| Aspen | 0.091 ± 0.003a | 0.085 ± 0.005a | 1.2 | 0.290 | 0.6 | 0.668 | |
| P/N | Birch | 0.19 ± 0.004a | 0.17 ± 0.005a | 3.3 | 0.078 | 1.5 | 0.227 |
| Aspen | 0.21 ± 0.005b | 0.22 ± 0.003b | 8.6 | 0.006 | 6.0 | <0.001 | |
| K/N | Birch | 0.37 ± 0.015a | 0.28 ± 0.009a | 30.4 | <0.001 | 1.8 | 0.144 |
| Aspen | 0.57 ± 0.021b | 0.44 ± 0.017b | 23.6 | <0.001 | 3.6 | 0.014 | |
| Ash, % | Birch | 0.41 ± 0.010a | 0.41 ± 0.009a | 0.1 | 0.749 | 2.0 | 0.118 |
| Aspen | 0.53 ± 0.008b | 0.56 ± 0.018b | 2.4 | 0.133 | 1.9 | 0.126 | |
| Calorific value, kJ g–1 | Birch | 19.62 ± 0.016a | 19.60 ± 0.018a | 1.0 | 0.309 | 1.0 | 0.275 |
| Aspen | 19.30 ± 0.026b | 19.29 ± 0.024b | 0.0 | 0.747 | 12.0 | <0.001 | |
| Density, g cm–3 | Birch | 0.51 ± 0.005a | 0.53 ± 0.009a | 2.0 | 0.165 | 0.4 | 0.779 |
| Aspen | 0.41 ± 0.007b | 0.41 ± 0.007b | 0.1 | 0.768 | 3.0 | 0.031 | |
| Table 2. Pairwise Pearson’s correlation coefficients among wood and tree growth characteristics in control (C) and humidified (H) plots, bold indicates significant (p < 0.05) relations. | |||||
| Wood characteristic | Tree species | Height | DBH | ||
| C | H | C | H | ||
| Cellulose | Aspen | –0.41 | 0.45 | –0.44 | 0.29 |
| Birch | –0.03 | 0.03 | –0.41 | –0.23 | |
| Lignin | Aspen | –0.61 | –0.47 | –0.50 | –0.45 |
| Birch | 0.38 | –0.14 | 0.41 | –0.20 | |
| Hemicellulose | Aspen | 0.75 | 0.01 | 0.68 | 0.20 |
| Birch | 0.17 | 0.35 | 0.35 | 0.63 | |
| [N] | Aspen | –0.65 | –0.54 | –0.53 | –0.44 |
| Birch | –0.35 | –0.63 | –0.24 | –0.28 | |
| [P] | Aspen | –0.60 | –0.58 | –0.39 | –0.48 |
| Birch | –0.01 | –0.57 | –0.29 | –0.41 | |
| [K] | Aspen | –0.40 | –0.51 | –0.35 | –0.45 |
| Birch | 0.21 | –0.02 | –0.09 | 0.06 | |
| Calorific value | Aspen | 0.12 | –0.26 | 0.26 | –0.23 |
| Birch | 0.40 | –0.17 | 0.64 | –0.26 | |
| Density | Aspen | –0.83 | –0.41 | –0.76 | –0.51 |
| Birch | 0.10 | 0.06 | –0.13 | 0.31 | |
| Ash content | Aspen | –0.44 | –0.53 | –0.41 | –0.38 |
| Birch | 0.15 | –0.41 | –0.09 | –0.22 | |
| Table 3. Pairwise partial correlations (controlling for the effect of DBH) among wood characteristics in control (C) and humidified (H) plots, bold indicates significant (p < 0.05) relations. View in new window/tab. |