| Table 1. Tree stand characteristics of the studied post-agricultural sites. |
| Age series: | 41–60 | 61–80 | > 80 |
| | On average ± standard deviation |
| Pinus sylvestris |
| No. of stems ha–1 | 1900 ± 212 | 1000 ± 158 | 820 ± 130 |
| Stems DBH [cm] | 15.9 ± 3.4 | 22.7 ± 5.1 | 30.1 ± 5.9 |
| Height of trees [m] | 13.3 ± 1.5 | 14.5 ± 2.0 | 18.7 ± 2.3 |
| Betula pendula |
| No. of stems ha–1 | 80 ± 109 | 62 ± 91 | 40 ± 55 |
| Stems DBH [cm] | 9.2 ± 2.7 | 19.1 ± 3.9 | 29.1 ± 3.5 |
| Height of trees [m] | 8.8 ± 1.9 | 11.3 ± 1.1 | 15.6 ± 1.9 |
| Mean volume of stand [m3·ha–1] * | 210 ± 57 | 247 ± 31 | 295 ± 37 |
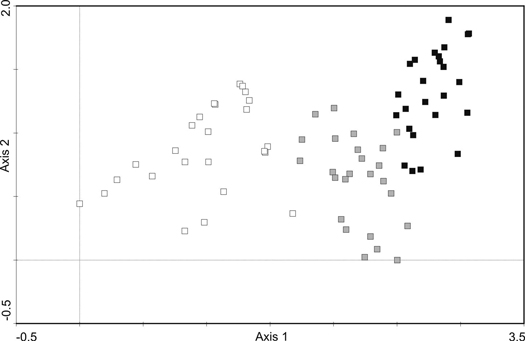
Fig. 1. DCA analysis of phytosociological samples from the Scots pine forests. The colour of symbols indicates three age-series of stands: white – 41–60, gray – 61–80, black – over 80-year-old. The first two axes explain 33.2% of the species cover variability.
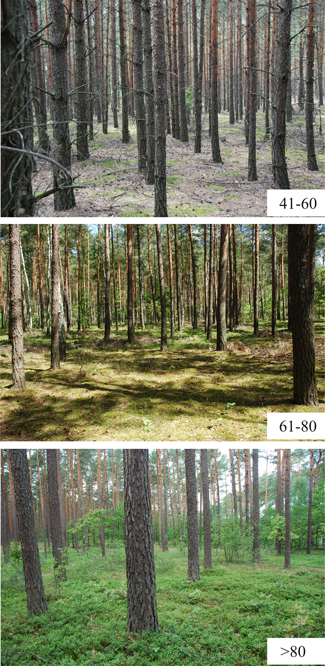
Fig. 2. Post-agricultural forests with Scots pine stands at the age of 41–60, 61–80 and over 80-years.
| Table 2. The mean percentage cover (calculated from the total cover values of layers noted in 25 research plots in each age series) and the mean number of species (with ± standard error) for the layers of trees, shrubs, understorey vascular plants and mosses in the stand age series of 41–60, 61–80- and over 80-year-old in the studied secondary Scots pine forests. For each variable (= within a row), stand age series marked with different letters are significantly different (P < 0.05). |
| Forest layer | ANOVA | Multiple comparisons |
| F | P | 41–60 (a) | 61–80 (b) | > 80 (c) |
| | Mean cover ± standard error |
| Tree layer | 15.65 | <0.0001 | 74.4 ± 1.01a | 66.8 ± 1.25b | 66.4 ± 1.14b |
| Shrub layer | 37.14 | <0.0001 | 1.4 ± 0.61a | 9.8 ±1.93b | 22.0 ± 2.14c |
| Understorey vascular plant layer | 293.97 | <0.0001 | 3.0 ± 0.42a | 40.8 ± 2.76b | 81.2 ± 2.79c |
| Moss layer | 14.76 | <0.0001 | 74.4 ± 2.39a | 90.8 ± 1.52b | 75.2 ± 3.06a |
| | Mean number of species ± standard error |
| Tree layer | 2.69 | ns | 1.24 ± 0.08 | 1.12 ± 0.06 | 1.40 ± 0.10 |
| Shrub layer | 68.52 | <0.0001 | 0.76 ± 0.19a | 2.88 ± 0.23b | 4.12 ± 0.19c |
| Understorey vascular plant layer | 348.34 | <0.0001 | 0.44 ± 0.10a | 6.32 ± 0.28b | 8.60 ± 0.26c |
| Moss layer | 4.80 | 0.0109 | 3.28 ± 0.14a | 3.28 ± 0.19a | 4.08 ± 0.28b |
| Table 3. Frequency and the mean cover (calculated from the original species cover values transformed to percentage cover values: + = 1.0; 1 = 5.0; 2 = 17.5; 3 = 37.5; 4 = 62.5; 5 = 87.5, according to Braun-Blanquet 1964; n = 25 in each age series) of plant species noted in Scots pine stands at the age of 41–60, 61–80 and over 80 years. Species characteristic of forest communities from the class: VP – Vaccinio-Piceetea, NC – Nardo-Callunetea, Ea – Epilobietea angustifolii, Qrp – Quercetea robori-petreae; found (+) in coniferous forests (CF) and/or in mixed coniferous-deciduous forests (MF), infiltrating from one forest type into (►) another one (according to Matuszkiewicz 2001); “-“ – species was not found; alien – species not native to flora of Poland. |
| Species names by forest communities | Age series: | 41–60 | 61–80 | > 80 | 41–60 | 61–80 | > 80 |
| Naturally occurs in | | | | | | |
| CF | | MF | Frequency [%] | Mean cover |
| Tree stand layer |
| Pinus sylvestris VP | + | | + | 100 | 100 | 100 | 73.50 | 60.50 | 55.50 |
| Betula pendula | + | | + | 24 | 12 | 40 | 0.48 | 1.10 | 3.50 |
| Shrub layer |
| Betula pendula | + | | + | 12 | 36 | 60 | 0.42 | 2.12 | 6.88 |
| Frangula alnus | + | | + | 12 | 28 | 32 | 0.24 | 1.86 | 0.70 |
| Quercus robur | + | ◄ | + | - | 32 | 68 | 0.00 | 1.38 | 8.80 |
| Sorbus aucuparia | + | ◄ | + | - | 24 | 24 | - | 1.02 | 0.66 |
| Pinus sylvestris VP | + | | + | - | 20 | 20 | 0.00 | 0.28 | 2.00 |
| Juniperus communis | + | | + | <10 | <10 | <10 | 0.40 | 0.02 | 0.02 |
| Padus serotina | alien | - | - | <10 | - | - | 0.22 |
| Shrubs and trees up to 0.9 m height |
| Betula pendula | + | | + | 20 | 56 | 72 | 0.10 | 1.00 | 3.34 |
| Frangula alnus | + | | + | 12 | 48 | 52 | 0.06 | 0.78 | 1.34 |
| Quercus robur | + | ◄ | + | <10 | 52 | 84 | 0.02 | 1.16 | 4.26 |
| Sorbus aucuparia | + | ◄ | + | <10 | 40 | 52 | 0.02 | 0.56 | 0.80 |
| Pinus sylvestris VP | + | | + | - | 32 | 80 | - | 0.70 | 3.02 |
| Quercus rubra | alien | - | - | 16 | - | - | 0.26 |
| Padus serotina | alien | - | - | 16 | - | - | 0.08 |
| Juniperus communis | + | | + | 12 | <10 | - | 0.06 | 0.04 | - |
| Understorey vascular plant layer |
| Vaccinium myrtillus VP | + | | + | <10 | 84 | 100 | 0.04 | 8.40 | 70.50 |
| Vaccinium vitis-idaea VP | + | ► | + | <10 | 88 | 100 | 0.02 | 17.40 | 9.92 |
| Festuca ovina | + | | + | 20 | 100 | 100 | 0.28 | 8.06 | 12.00 |
| Melampyrum pratense VP | + | ► | + | <10 | 84 | 76 | 0.04 | 3.08 | 7.88 |
| Calluna vulgaris NC | + | | + | - | 76 | 72 | - | 4.36 | 3.48 |
| Luzula pilosa | + | ◄ | + | - | 24 | 88 | - | 0.30 | 1.52 |
| Pteridium aquilinum | + | ◄ | + | - | 16 | 52 | - | 0.44 | 4.24 |
| Antoxantum odoratum | | | + | - | 16 | 48 | - | 0.08 | 0.78 |
| Deschampsia caespitosa | | ◄ | + | - | 12 | <10 | - | 0.06 | 0.02 |
| Carex ovalis | + | | + | - | 40 | 76 | - | 1.10 | 1.82 |
| Calamagrostis epigejos Ea | + | | + | - | 16 | 32 | - | 0.94 | 1.02 |
| Deschampsia flexuosa | + | ► | + | - | 16 | 40 | - | 0.08 | 0.74 |
| Dryopteris carthusiana | + | | + | - | <10 | 40 | - | 0.02 | 0.56 |
| Carex hirta | + | | + | - | 20 | <10 | - | 0.28 | 0.02 |
| Trientalis europaea VP | + | | + | - | <10 | <10 | - | 0.04 | 0.04 |
| Juncus effusus | | | + | - | 12 | - | - | 0.06 | - |
| Hieracium pilosella NC | + | | + | - | 16 | - | - | 0.44 | - |
| Hieracium murorum Qrp | + | ◄ | + | - | - | 12 | - | - | 0.06 |
| Scorzonera humilis | + | | + | - | - | <10 | - | - | 0.04 |
| Astragalus arenarius | - | | - | <10 | - | - | 0.02 | - | - |
| Moss layer |
| Pleurozium schreberi VP | + | ► | + | 100 | 100 | 100 | 32.84 | 53.30 | 63.50 |
| Dicranum polysetum VP | + | ► | + | 88 | 100 | 96 | 6.58 | 36.40 | 14.20 |
| Hypnum cupressiforme Qrp | ◄ | + | 16 | 52 | 68 | 0.26 | 0.98 | 1.60 |
| Sciuro-hypnum oedipodium | + | | | 100 | 40 | - | 19.42 | 0.74 | 0.00 |
| Dicranum scoparium VP | + | ► | + | <10 | <10 | 56 | 0.02 | 0.02 | 2.72 |
| Pohlia nutans | + | | + | <10 | 16 | 48 | 0.04 | 0.26 | 0.96 |
| Leucobryum glaucum VP | + | | | - | 16 | 16 | - | 0.94 | 0.26 |
| Thuidium tamariscinum | + | | + | - | - | 24 | - | - | 0.48 |
| Polytrichum piliferum | - | | - | <10 | - | - | 0.04 | - | - |
| Ptilium crista-castrensis VP | + | ► | | <10 | - | - | 0.02 | - | - |
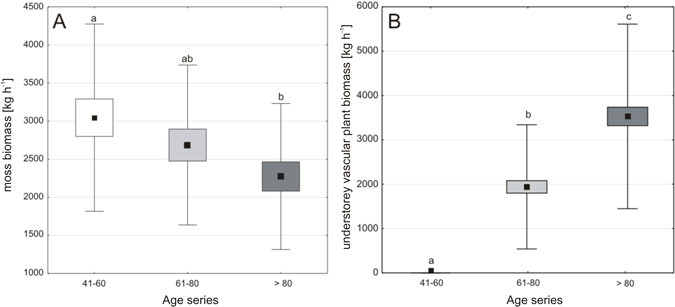
Fig. 3. Comparison of the moss biomass (A) and understorey vascular plant biomass (B) for the three age-series of forest stands; forest stands at the age of 41–60 (a), 61–80 (b) and over 80 years (c); dot – mean, box – interquartile range, whiskers – range of variability (min-max). Means with different letters above whiskers differ at P < 0.05 in post-hoc comparisons.
| Table 4. The coefficient of determination (r2) and a-slope parameter from the linear regression equation (y = ax + b) for the biomass and the species percentage covers of six species which dominate in the understory of 41–60- (a), 61–80- (b) and > 80- (c) year-old Scots pine forests and their significance (One-Way ANOVA). For each variable (= within a row), stand age series with different letters are significantly different (P < 0.05). |
| Species name | Biomass calculation | ANOVA | Multiple comparisons |
| 41–60 | 61–80 | > 80 |
| r² | a | F | P | Mean biomass [kg ha–1] ± standard error |
| Pleurozium schreberi | 0.6347 | 0.2672 | 13.28 | <0.0001 | 877.5 ± 110.2a | 424.2 ± 132.4b | 696.7 ± 98.18b |
| Dicranum polysetum | 0.7301 | 0.4153 | 31.51 | <0.0001 | 273.3 ± 76.4a | 1511.7 ± 137.2b | 589.7 ± 121.4a |
| Sciuro-hypnum oedipodium | 0.8955 | 0.2988 | 36.73 | <0.0001 | 580.3 ± 93.5a | 22.1 ± 9.7b | 0.0b |
| Vaccinium myrtillus | 0.8640 | 0.4058 | 194.60 | <0.0001 | 1.6 ± 1.1a | 340.9 ± 87.8a | 2860.9 ± 173.0b |
| Vaccinium vitis-idaea | 0.8035 | 0.3710 | 18.82 | <0.0001 | 0.7 ± 0.7a | 645.5 ± 90.2b | 368.0 ± 92.4c |
| Calluna vulgaris | 0.8248 | 0.2645 | 5.65 | 0.005 | 0.0a | 115.3 ± 32.9b | 92.0 ± 29.92b |
| Table 5. The mass of organic carbon (C) and total nitrogen (N) sequestered by six dominant species in 41–60- (a), 61–80- (b) and > 80-year-old (c) Scots pine forests. For each variable (= within a row), stand age series with different letters are significantly different (P < 0.05). |
| Species name | ANOVA | | Multiple comparisons |
| 41–60 | 61–80 | > 80 |
| F | P | [kg ha–1] ± standard error |
| Pleurozium schreberi | 13.28 | <0.0001 | C | 395.75 ± 49.69a | 642.30 ± 59.72b | 765.22 ± 44.28b |
| N | 10.22 ± 1.28a | 16.59 ± 1.54b | 19.77 ± 1.14b |
| Dicranum polysetum | 31.51 | <0.0001 | C | 135.27 ± 37.83a | 748.29 ± 67.93b | 291.91 ± 60.10a |
| N | 2.77 ± 0.77a | 15.33 ± 1.39b | 5.98 ± 1.23a |
| Sciuro-hypnum oedipodium | 36.73 | <0.0001 | C | 261.70 ± 42.16a | 9.97 ± 4.37b | 0.0b |
| N | 7.08 ± 1.14a | 0.27 ± 0.12b | 0.0b |
| Vaccinium myrtillus | 194.60 | <0.0001 | C | 0.8 ± 0.57a | 172.48 ± 44.40a | 1447.61 ± 87.52b |
| N | 0.02 ± 0.01a | 3.16 ± 0.81a | 26.55 ± 1.61b |
| Vaccinium vitis-idaea | 18.82 | <0.0001 | C | 0.33 ± 0.33a | 287.27 ± 40.12b | 163.77 ± 41.13c |
| N | 0.005 ± 0.005a | 4.78 ± 0.66b | 2.73 ± 0.68c |
| Calluna vulgaris | 5.65 | 0.005 | C | 0.0a | 54.09 ± 15.42b | 43.17 ± 14.04b |
| N | 0.0a | 0.96 ± 0.27b | 0.58 ± 0.13b |
| In total: |
| C | 262.72 | <0.0001 | | 793.87 ± 40.45a | 1914.39 ± 333.65b | 2711.70 ± 335.78c |
| N | 207.27 | <0.0001 | | 20.09 ± 0.97a | 41.10 ± 1.34b | 55.79 ± 1.38c |