| Table 1. The results of chi-square tests for the total set of surveys and for pairwise comparisons. View in new window/tab. |
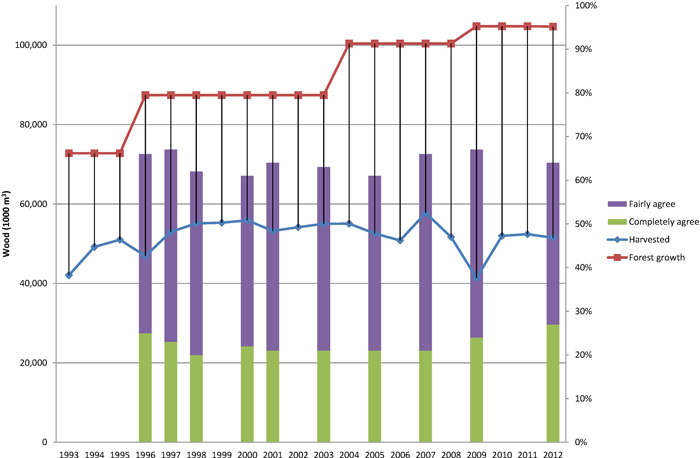
Fig. 1. Wood harvested in Finland and the perception of Finns on the statement “Forests grow more wood than the amount harvested”.
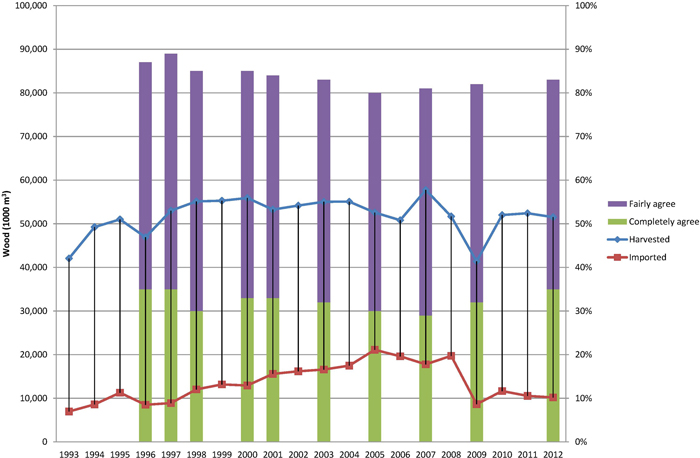
Fig. 2. Wood harvested and imported in Finland and the perception of Finns on the statement “In our forests, abundant wood is available as a raw material for the forest industry”.
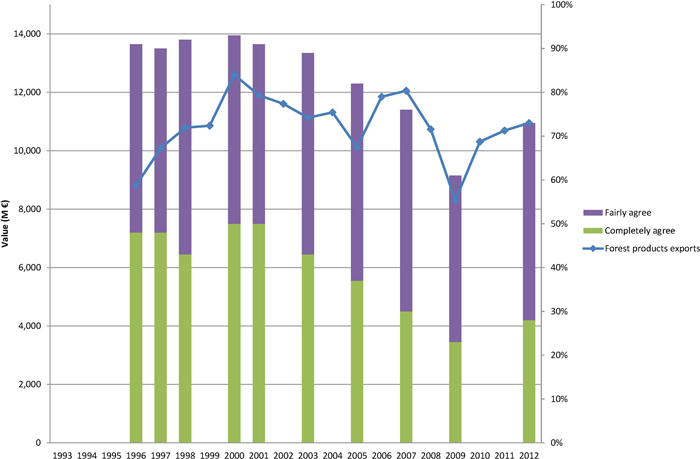
Fig. 3. Forest industry exports from Finland and the perception of Finns on the statement “The forest industry performs well in international competition”.
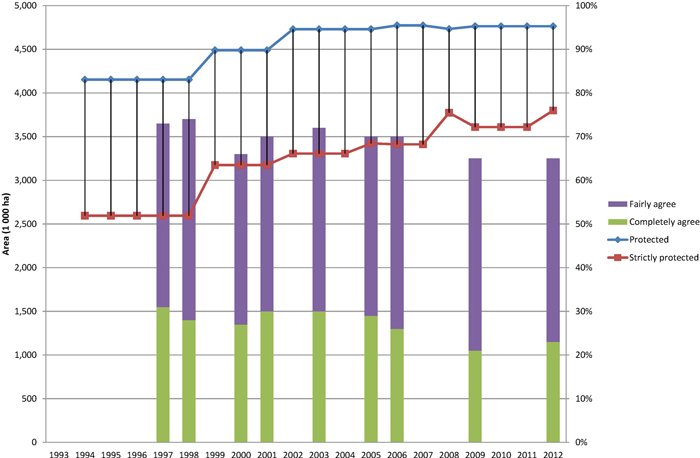
Fig. 4. Protected forests in Finland and the perception of Finns on the statement “The amount of protected forests is adequate”. The correlation coefficient is –0.72.
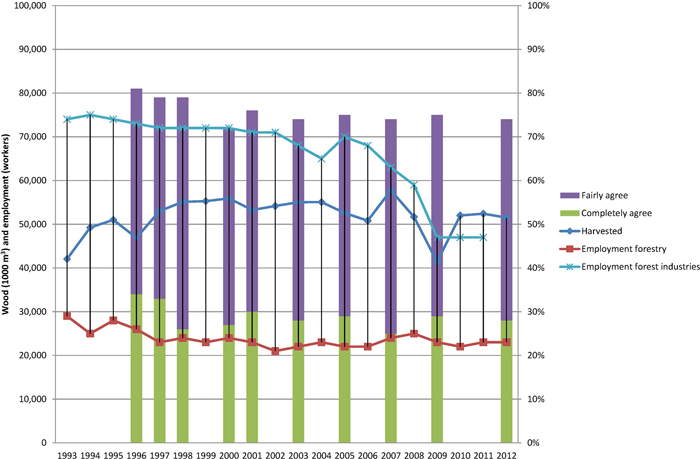
Fig. 5. Wood harvested and employment in the forest sector in Finland and the perception of Finns on the statement “One has to intensify forest harvesting to improve employment and maintain welfare”.
| Table 2. Unemployment rate in Finland. | ||||||||
| 1995 | 1996 | 1997 | 1998 | 1999 | 2000 | 2001 | 2002 | 2003 |
| 15.2 | 14.6 | 12.7 | 11.4 | 10.2 | 9.8 | 9.1 | 9.1 | 9.0 |
| 2004 | 2005 | 2006 | 2007 | 2008 | 2009 | 2010 | 2011 | 2012 |
| 8.8 | 8.4 | 7.7 | 6.9 | 6.4 | 8.2 | 8.4 | 7.8 | 7.7 |
| Source: Statistics Finland, Labour force survey | ||||||||