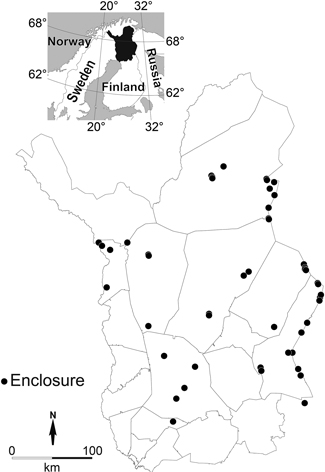
Fig. 1. Location of the study stands in the reindeer herding area in northern Finland.
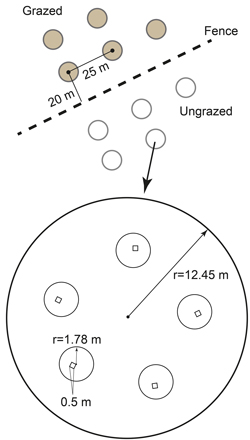
Fig. 2. Experiment set-up showing five circular (487 m2) sample plots on both sides of the fence in systematic grid. In each sample plot there are five smaller (10 m2) circular plots, and within each of these a 0.5 × 0.5 m square plot.
| Table 1. Description of the sample plots. The column N denotes the number and proportion (in parenthesis, %) of the sample plots where a variable has other values than 0. The values of the stand level variables have been calculated using the stand level data (same values for all the sample plots). |
| Variable/category | N (%) | Min | Max | Mean | Sd | Median |
| Sample plot level variables |
| Lichen cover, % | 482 (100) | 0.1 | 93.0 | 25.7 | 24.2 | 17.7 |
| Estimated dry biomass of lichens, kg ha–1 | 482 (100) | 0.0 | 9043.0 | 1459.5 | 1975.1 | 481.6 |
| Cover of harvesting residue, % | 330 (68) | 2.5 | 30.0 | 5.4 | 5.4 | 2.5 |
| Basal area of Scots pine, m2 ha–1 | 440 (91) | 1.0 | 29.0 | 10.6 | 5.6 | 11.0 |
| Basal area of Norway spruce, m2 ha–1 | 32 (7) | 1.0 | 6.0 | 2.3 | 1.6 | 2.0 |
| Basal area of deciduous trees, m2 ha–1 | 63 (13) | 1.0 | 11.0 | 2.4 | 2.0 | 2.0 |
| Basal area, total, m2 ha–1 | 447 (93) | 1.0 | 29.0 | 10.9 | 5.5 | 11.0 |
| Diameter1.3 of Scots pine, cm | 440 (91) | 8.1 | 51.5 | 20.5 | 7.2 | 19.8 |
| Diameter1.3 of Norway spruce, cm | 32 (7) | 10.0 | 24.0 | 17.7 | 4.8 | 16.9 |
| Diameter1.3 of deciduous trees, cm | 63 (13) | 7.8 | 38.1 | 17.7 | 6.5 | 16.4 |
| Height of Scots pine, cm | 400 (91) | 4.4 | 21.1 | 12.5 | 3.1 | 12.7 |
| Height of Norway spruce, m | 32 (6.6) | 6.5 | 17.1 | 10.3 | 2.3 | 10.4 |
| Height of deciduous trees, m | 63 (13) | 4.9 | 16.2 | 9.6 | 2.8 | 9.0 |
| Age of Scots pine, years | 440 (91) | 19.0 | 310.0 | 96.3 | 69.3 | 72.3 |
| Age of Norway spruce, years | 32 (7) | 35.0 | 230.0 | 100.8 | 61.7 | 75.0 |
| Number of Scots pine stems ha–1 | 440 (91) | 5.0 | 2210.0 | 464.7 | 417.4 | 347.5 |
| Number of Norway spruce stems ha–1 | 32 (7) | 17.5 | 442.1 | 114.5 | 97.1 | 85.2 |
| Number of deciduous stems ha–1 | 63 (13) | 14.4 | 808.4 | 153.1 | 170.9 | 72.2 |
| Total number of stems ha–1 | 447 (93) | 5.1 | 2210.5 | 487.1 | 412.0 | 370.0 |
| Number of Scots pine seedlings ha–1 | 431 (89) | 40.0 | 9800.0 | 726.2 | 1045.9 | 400.0 |
| Number of Norway spruce seedlings ha–1 | 76 (16) | 40.0 | 1280.0 | 156.8 | 257.1 | 40.0 |
| Number of deciduous seedlings ha–1 | 145 (30) | 40.0 | 4280.0 | 387.6 | 518.6 | 200.0 |
| Total number of seedlings ha–1 | 461 (95) | 40.0 | 9840.0 | 826.7 | 1053.8 | 480.0 |
| Predicted proportion of canopy cover (0–1) | 483 (100) | 0.1 | 0.98 | 0.5 | 0.2 | 0.6 |
| Number of reindeer summer pellets ha–1 | 52 (11) | 1.0 | 5.0 | 1.8 | 1.1 | 1.0 |
| Number of reindeer winter pellets ha–1 | 200 (41) | 1.0 | 38.0 | 8.1 | 0.6 | 5.0 |
| Stand level variables |
| Altitude, m.a.s.l | 49 (100) | 114.9 | 321.4 | 215.1 | 56.9 | 225.0 |
| Average temperature sum during 1961–1990, d.d. | 49 (100) | 650.5 | 924.0 | 732.7 | 62.2 | 708.0 |
| Time since fencing, years | 49 (100) | 10.0 | 90.0 | 42.9 | 3.4 | 40.0 |
| Table 2. The parameter estimates, their standard errors, t-values and Wald chi-square tests for the terms in the lichen cover model. P-values (p) are calculated for the variables in the model based on Wald’s chi-square statistics. Reference category and the tests against the reference categories are printed in italics. Stand development classification, see Section 2.1 Data collection. |
| Variable/effect | Estimate | Standard error | t-/chi-value | p |
| Fixed effects |
| Intercept | –1.480 | 0.281 | –5.27/28.76 | 0.000 |
| Grazing (grazed, ungrazed) | - | - | 271.34 | 0.000 |
| – ungrazed | 2.156 | 0.133 | 16.20 | 0.000 |
| Stand development class (1,2,3,4) | - | - | 2.20 | 0.533 |
| – 2 | 0.020 | 0.384 | –0.05 | 0.958 |
| – 3 | –0.755 | 0.614 | –1.23 | 0.220 |
| – 4 | –0.460 | 0.455 | –1.01 | 0.312 |
| Canopy cover | –1.015 | 0.512 | –1.98/4.06 | 0.044 |
| Site type (barren heath, xeric, sub-xeric) | - | - | 114.99 | 0.000 |
| – xeric | –0.595 | 0.089 | –6.66 | 0.000 |
| – sub-xeric | –1.557 | 0.149 | –10.49 | 0.000 |
| Soil type (moraine, sorted) | - | - | 8.51 | 0.004 |
| – sorted | 0.584 | 0.203 | 2.87 | 0.004 |
| Cover of harvesting residue | –0.030 | 0.010 | –2.87/8.55 | 0.003 |
| Grazing * Stand development class | - | - | 36.26 | 0.000 |
| – ungrazed and 2 | 0.221 | 0.221 | 1.00 | 0.318 |
| – ungrazed and 3 | 0.136 | 0.251 | 0.54 | 0.590 |
| – ungrazed and 4 | –0.747 | 0.171 | –4.38 | 0.000 |
| Stand development class * Canopy cover | - | - | 17.56 | 0.000 |
| – 2 and canopy cover | –1.096 | 0.698 | –1.57 | 0.117 |
| – 3 and canopy cover | 0.230 | 1.025 | 0.22 | 0.884 |
| – 4 and canopy cover | 2.115 | 0.760 | 2.78 | 0.006 |
| Random effects |
| Stand (intercept) | 0.477 | | | |
| Residual | 0.056 | | | |
| Table 3. Lichen cover model: pairwise tests and tests for the trends differing from 0 by the categories (interactions). Stand development classification, see Section 2.1 Data collection. |
| Variable/categories | p | Variable/categories | p |
| Site type | | Ungrazed, 1 vs. 2 | 0.450 |
| Barren heath vs. Xeric | 0.000 | Ungrazed, 1 vs. 3 | 0.370 |
| Barren heath vs. Sub-xeric | 0.000 | Ungrazed, 1 vs. 4 | 1.000 |
| Xeric vs. Sub-xeric | 0.000 | Ungrazed, 2 vs. 3 | 0.999 |
| | | Ungrazed, 2 vs. 4 | 0.777 |
| Grazing * Stand development class | | Ungrazed, 3 vs. 4 | 0.463 |
| Grazed, 1 vs. 2 | 0.260 | | |
| Grazed, 1 vs. 3 | 0.374 | Stand development class * Canopy cover | |
| Grazed, 1 vs. 4 | 0.119 | 1 * Canopy cover | 0.044 |
| Grazed, 2 vs. 3 | 1.000 | 2 * Canopy cover | 0.000 |
| Grazed, 2 vs. 4 | 0.000 | 3 * Canopy cover | 0.371 |
| Grazed, 3 vs. 4 | 0.000 | 4 * Canopy cover | 0.048 |
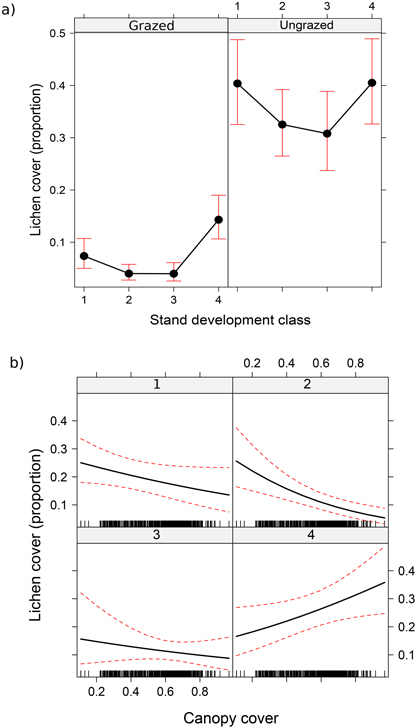
Fig. 3. Effect of grazing and stand development class (a), and canopy cover and stand development class (b) on lichen cover. Values represent predicted mean effects and 95% confidence limits.
| Table 4. The parameter estimates, their standard errors, t-values and Wald chi-square tests for the terms in the lichen biomass model. P-values (p) are calculated for the variables in the model based on Wald’s chi-square statistics. Reference category and the tests against the reference categories are printed in italics. Stand development classification, see Section 2.1 Data collection. |
| Variable/effect | Estimate | Standard error | t-/chi-value | p |
| Fixed effects |
| Intercept | 8.138 | 1.190 | 6.84/46.74 | 0.000 |
| Grazing (grazed, ungrazed) | - | - | 621.12 | 0.000 |
| – ungrazed | 2.988 | 0.120 | 24.92 | 0.000 |
| Stand development class (1,2,3,4) | - | - | 4.19 | 0.242 |
| – 2 | 0.531 | 0.342 | 1.55 | 0.122 |
| – 3 | –0.401 | 0.499 | –0.80 | 0.422 |
| – 4 | 0.119 | 0.427 | 0.28 | 0.781 |
| Canopy cover | –0.473 | 0.489 | –0.97/0.94 | 0.333 |
| Temperature sum | –0.004 | 0.002 | –2.53 /6.37 | 0.012 |
| Site type (barren heath, xeric, sub-xeric) | - | - | 74.17 | 0.000 |
| – xeric | –0.423 | 0.084 | –5.06 | 0.000 |
| – sub-xeric | –1.060 | 0.123 | –8.60 | 0.000 |
| Soil type (moraine, sorted) | - | - | 7.22 | 0.007 |
| – sorted | 0.524 | 0.195 | 2.69 | 0.007 |
| Grazing * Stand development class | - | - | 65.03 | 0.000 |
| – ungrazed and 2 | –0.053 | 0.169 | –0.31 | 0.754 |
| – ungrazed and 3 | 0.047 | 0.186 | 0.25 | 0.800 |
| – ungrazed and 4 | –1.004 | 0.155 | –6.46 | 0.000 |
| Stand development class * Canopy cover | - | - | 15.37 | 0.002 |
| – 2 and canopy cover | –1.163 | 0.631 | –1.84 | 0.066 |
| – 3 and canopy cover | 0.355 | 0.834 | 0.43 | 0.670 |
| – 4 and canopy cover | 1.544 | 0.712 | 2.17 | 0.031 |
| Random effects |
| Stand (intercept) | 0.45 | | | |
| Residual | 1.84 | | | |
| Table 5. Lichen biomass model: pairwise tests and tests for the trends differing from 0 by the categories (interactions). Stand development classification, see Section 2.1 Data collection. |
| Variable/categories | p | Variable/categories | p |
| Site type | | Ungrazed, 1 vs. 2 | 0.991 |
| Barren heath vs. Xeric | 0.000 | Ungrazed, 1 vs. 3 | 0.994 |
| Barren heath vs. Sub-xeric | 0.000 | Ungrazed, 1 vs. 4 | 1.000 |
| Xeric vs. Sub-xeric | 0.000 | Ungrazed, 2 vs. 3 | 1.000 |
| | | Ungrazed, 2 vs. 4 | 1.000 |
| Grazing * Stand development class | | Ungrazed, 3 vs. 4 | 0.999 |
| Grazed, 1 vs. 2 | 1.000 | | |
| Grazed, 1 vs. 3 | 0.988 | Stand development class * Canopy cover | |
| Grazed, 1 vs. 4 | 0.001 | 1 * Canopy cover | 0.333 |
| Grazed, 2 vs. 3 | 0.999 | 2 * Canopy cover | 0.000 |
| Grazed, 2 vs. 4 | 0.000 | 3 * Canopy cover | 0.862 |
| Grazed, 3 vs. 4 | 0.000 | 4 * Canopy cover | 0.039 |
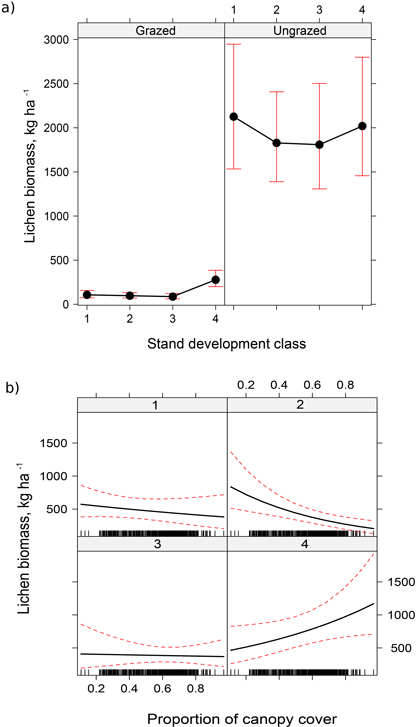
Fig. 4. Effect of grazing and stand development class (a), and canopy cover and stand development class (b) on the estimated dry biomass of lichens. Values represent predicted mean effects and 95% confidence limits.
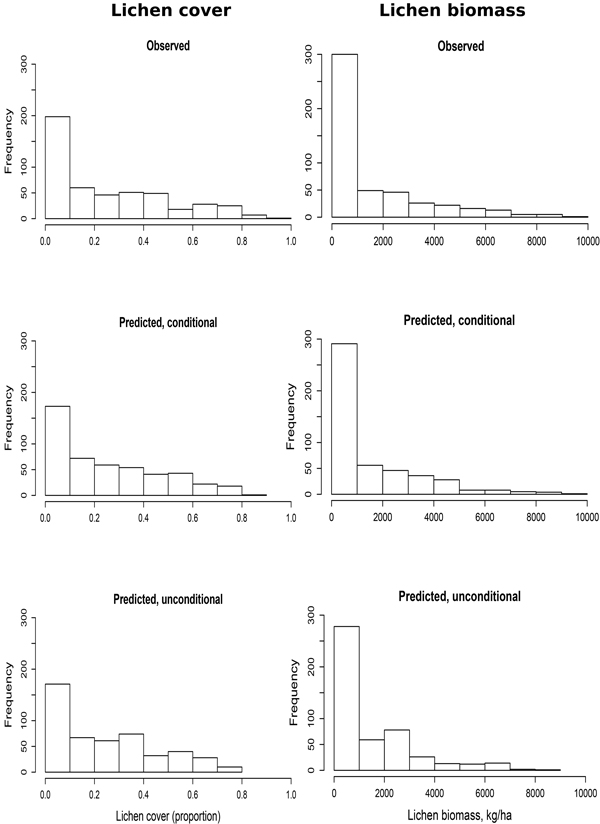
Fig. 5. Fit of the lichen cover and lichen biomass models. ‘Conditional’ denotes the estimates calculated using both fixed and random part of the model (random intercept). ‘Unconditional’ denotes the estimates calculated by using only the fixed coefficients.
| Table 6. Estimated lichen covers and dry biomasses according to some recent studies. |
| Study | Cover, % | Biomass, dw kg ha–1 |
| Grazed | Ungrazed | Grazed | Ungrazed |
| This study | 6.8 | 35.8 | 130 | 1929 |
| Mattila 2004 | 3.8 | 7.1 | 64 | 425 |
| Väre et al. 1996 | | | 860 | 7900 |
| Susiluoto et al. 2008 | | | 500 | 3550 |
| Olofsson et al. 2010 a) | | | 253 | 642 |
| Köster et al. 2013 | | | 900 | 3500 |