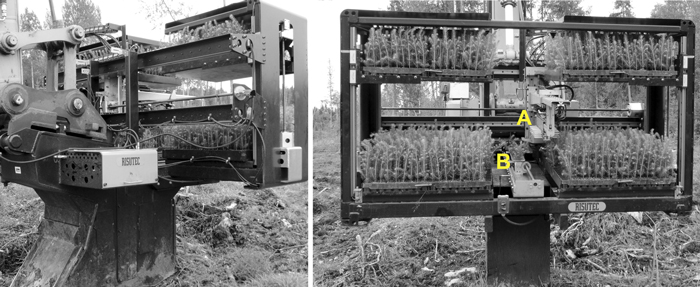
Fig. 1. Risutec APC planting device. Loader (A) selects one row of nine seedlings from cultivation trays and loads them into the feeder (B) from which they are planted one at the time. Photos: Tiina Laine.
| Table 1. Pooled work-difficulty conditions for the four planting sites. | |||||
| Work difficulty factor | N | Mean | Min. | Max. | SD |
| Slash (% of points) | 240 | 3.8 | 0.0 | 20.0 | 5.9 |
| Surface obstacles (obstacles ha–1) | 48 | 308.3 | 66.7 | 600.0 | 151.8 |
| Stumps (stumps ha–1) | 48 | 308.3 | 0.0 | 733.3 | 216.2 |
| Stoniness (% of points) | 432 | 32.4 | 11.1 | 70.4 | 15.6 |
| Humus layer > 10 cm (% of points) | 240 | 25.8 | 0.0 | 66.7 | 21.8 |
| Table 2. Work elements of mechanized planting. Work elements performed by both machines are marked with an asterisk, only by Risutec are marked with R, and only by Bracke with B. | |
| Element | Definition |
| Mounding | Starts when mounding blade touches the ground and ends when mound is compressed. Also includes the time when boom is used to move obstacles that prevent mounding (e.g., stones or slash).* |
| Planting | Starts when mounding is complete and ends when planting unit lifts after planting.* |
| Moving the base machine | When excavator tracks are moving.* |
| Moving the boom | All boom movements.* |
| Interruptions | Any activity or interruption in the work of < 15 min duration that occurred during work time.* |
| Loading seedling storage rack | Time needed to load seedling storage rack. In case of Risutec, this includes filling the plant container also. Notice that seedlings need to be deplugged from cultivation trays manually prior to loading to the Risutec APC.* |
| Reloading seedling cassette | Time needed to seedling-wise reload seedling cassette.B |
| Automatic feeding system | Time when automatic feeding system is in operation. After the seventh seedling is planted, the loader starts to select another nine seedlings from the cultivation tray. After the ninth seedling is planted, the feeder returns to resupply with seedlings while mounds can be formed. While loading of the nine seedlings into the feeder the whole machine remains stationary. R |
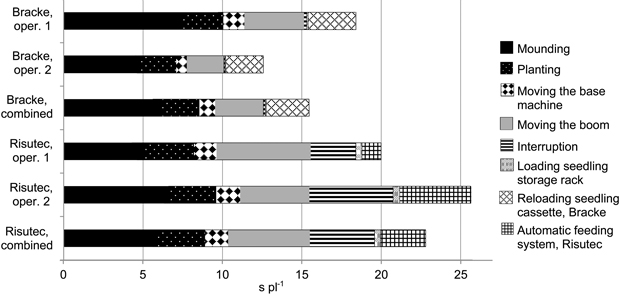
Fig. 2. Work-time distribution (seconds per seedling [s pl–1]) based on productive work time including delays < 15 min (PWh15) for both planting machines and operators.
| Table 3. Measured mean productivities (seedlings per hour [pl h–1]) of planting machines and operators for productive work time (PWh0) and productive work time including delays < 15 min (PWh15). | |||||||
| Planting device | Operator | N | Mean, PWh0 | Min. | Max. | SD | Mean, PWh15 |
| Risutec | 1 | 4 | 215 | 202 | 235 | 15.6 | 184 |
| 2 | 4 | 177 | 169 | 190 | 9.8 | 143 | |
| Combined | 8 | 196 | 169 | 235 | 23.4 | 163 | |
| Bracke | 1 | 4 | 199 | 177 | 239 | 27.6 | 199 |
| 2 | 4 | 290 | 253 | 317 | 27.2 | 289 | |
| Combined | 8 | 244 | 177 | 317 | 55.5 | 244 | |
| Table 4. A linear mixed-effect model for predicting productivity of planting work. The model was based on productive work time (PWh0) excluding the time required to reload the seedling storage rack. | ||||
| Variable | Estimate | Standard error | t-value | p-value |
| Intercept | 331.39 | 9.16 | 37.56 | 0.00 |
| [Device = Risutec] | –111.47 | 7.29 | –15.29 | 0.00 |
| [Operator = 1] | –106.47 | 7.71 | –13.80 | 0.00 |
| Stoniness | –1.10 | 0.20 | –5.56 | 0.00 |
| [Operator = 1] * [Device = Risutec] | 133.81 | 10.32 | 12.97 | 0.00 |
| Variance | Standard error of variance | SD | ||
| Planting area | 15.98 | 36.11 | 4.00 | |
| Block | 0.00 | 0.00 | 0.00 | |
| Residual | 106.00 | 0.00 | 10.30 | |
| Table 5. Share of planting events and related features for both planting machines and operators (mean values). | ||||||||
| Planting device | Operator | Planting events | Seedlings in mounds | Successfully planted (%) | Outcome of planting events (% of events) | |||
| Planting after mounding | Planting on mounds made separately | Unsuccessful | New planting attempt | |||||
| Risutec | 1 | 736 | 602 | 92.9 | 49.5 | 31.9 | 3.3 | 15.4 |
| 2 | 661 | 587 | 91.9 | 88.5 | 0.3 | 2.0 | 9.2 | |
| Combined | 1397 | 1189 | 92.4 | 67.9 | 17.0 | 2.6 | 12.5 | |
| Bracke | 1 | 700 | 662 | 95.1 | 94.4 | 0.6 | 0.7 | 4.3 |
| 2 | 717 | 684 | 96.1 | 95.4 | 0.0 | 0.0 | 4.6 | |
| Combined | 1417 | 1346 | 95.6 | 94.9 | 0.3 | 0.4 | 4.4 | |
| Table 6. Planting density (seedlings per ha [pl ha–1]) and the percentage of seedlings exhibiting some planting defect (%). | |||||||||||
| Planting device | Operator | Planting density (pl ha–1) | Planting defects (%) | ||||||||
| N | Mean | Min. | Max. | SD | N | Mean | Min. | Max. | SD | ||
| Risutec | 1 | 4 | 2150 | 1800 | 2400 | 300 | 4 | 22.5 | 10.0 | 33.3 | 11.0 |
| 2 | 4 | 1850 | 1600 | 2000 | 191.5 | 4 | 27.5 | 10.0 | 40.0 | 12.6 | |
| Combined | 8 | 2000 | 1600 | 2400 | 282.8 | 8 | 25.0 | 10.0 | 40.0 | 11.3 | |
| Bracke | 1 | 4 | 2000 | 1600 | 2400 | 326.6 | 4 | 16.7 | 10.0 | 20.0 | 14.1 |
| 2 | 4 | 1700 | 1600 | 2000 | 200.0 | 4 | 14.1 | 0.0 | 36.4 | 17.6 | |
| Combined | 8 | 1850 | 1600 | 2400 | 297.6 | 8 | 15.4 | 0.0 | 36.4 | 12.0 | |
| Table 7. Fixed costs (i.e., base machine, planting device and administration), variable costs, total costs (€ per hour [€ h–1]) and unit costs (€ per seedling [€ pl–1]) of Bracke and Risutec APC as well as an idealized planting machine with automatic feeding system (AUT), based on productive work time including delays < 15 min (PWh15). | |||
| Bracke | Risutec APC | AUT | |
| Base machine (€ h–1) | 9.91 | 9.79 | 9.89 |
| Planting device (€ h–1) | 6.94 | 12.30 | 11.90 |
| Administrative costs (€ h–1) | 3.25 | 3.21 | 3.27 |
| Fixed costs (€ h–1) | 20.10 | 25.30 | 25.06 |
| Variable costs (€ h–1) | 46.87 | 45.93 | 49.20 |
| Total costs (€ h–1) | 66.97 | 71.24 | 74.26 |
| Unit costs (€ pl–1) | 0.28 | 0.39 | 0.27 |
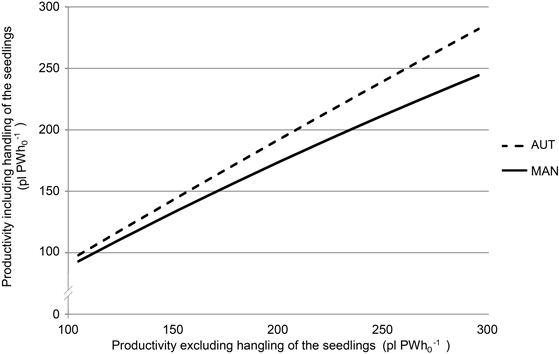
Fig. 3. Productivities (seedlings per productive work hour [pl PWh0–1]) for planting machines with (AUT) and without (MAN) automatic feeding system when excluding (x-axis) and including (y-axis) time used for handling the seedlings. Handling the seedlings involves time spent loading the seedling storage rack (MAN + AUT) and reloading the seedling cassette (MAN).
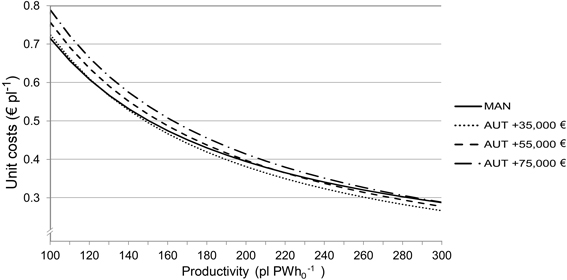
Fig. 4. Unit costs (€ per seedling (€ pl–1]), of mechanized planting with the Bracke planting machine (MAN) and additional cost of an idealized automatic feeding system (AUT) at different productivity levels (seedlings per productive work hour [pl PWh0–1]). Purchase price of the MAN was set to 45 000 €.