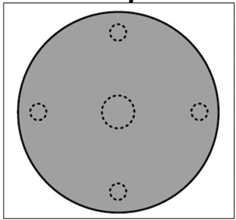
Fig. 1. Location of seedling survey plots in the canopy gaps.
| Table 1. Characteristics of the crop seedling data measured in spring 2013 from spruce mire canopy gaps. The gaps were cut in 2004. | ||||
| Mean | Min | Max | sd | |
| h | 64.7 | 20 | 270 | 43.5 |
| ih | 7.1 | 1 | 31 | 4.7 |
| N | 1809 a) | 333 | 2997 | 873 |
| h = seedling height, cm ih = seedling height growth, cm a–1 N = seedling density, ha–1 a) 1645 ha–1 if three gaps with no crop seedlings are included. | ||||
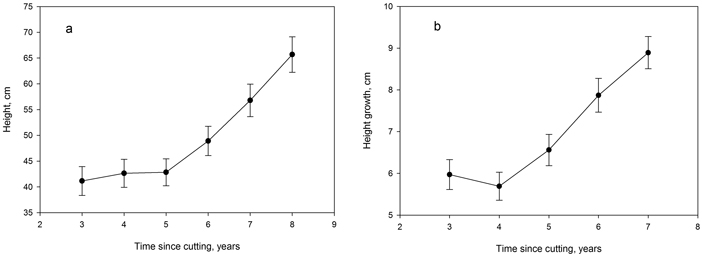
Fig. 2. Average observed height (a) and height growth (b) of spruce crop seedlings in the canopy gaps at different years after cutting (2004) calculated from the 2013 survey data. Vertical lines indicate the standard error of means.
| Table 2. Model for Norway spruce advance growth seedling annual height growth (ln(ih+0.5)) after cutting of canopy gaps in a drained spruce mire (see Eq. 1). | |||
| Variable | Estimate | Std. error | p-value |
| Intercept | 2.0717 | 0.3600 | <0.0001 |
| Height | 0.006656 | 0.000775 | <0.0001 |
| Time | –0.6391 | 0.2590 | 0.0139 |
| Time_20m | 0.04613 | 0.01340 | 0.0010 |
| Time13 | 0.3356 | 0.1227 | 0.0064 |
| 15m_C | 0.3491 | 0.1059 | 0.0017 |
| 15m_N | 0.2815 | 0.1340 | 0.0390 |
| 20m_S | –0.4110 | 0.1265 | 0.0017 |
| var(vij) | 0.02041 | 0.0119 | 0.0431 |
| var(mijk) | 0.03774 | 0.01350 | 0.0026 |
| AR1 | 0.2975 | 0.05173 | <0.0001 |
| var(eijkt) | 0.1324 | 0.009278 | <0.0001 |
| Mean bias | –0.84 cm | ||
| Height = seedling height at the beginning of growing season, cm Time = time since gap cutting, years Time_20 = dummy variable; for 20 m gap = 1, otherwise = 0 Time13 = (time)1.3 15m_C = dummy variable; for central location of 15 m gap = 1, otherwise = 0 15m_N = dummy variable; for northern location of 15 m gap = 1, otherwise = 0 20m_S = dummy variable; for southern location of 20 m gap = 1, otherwise = 0 | |||
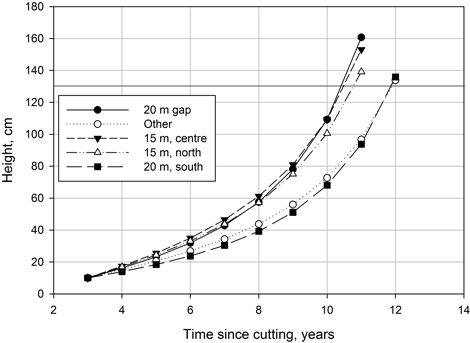
Fig. 3. Height development of spruce crop seedlings as a function of time since cutting in gaps of different sizes and in different locations within the gap according to the height growth model (Table 2). Other = all other gaps and locations except those shown by a separate curve. Initial seedling height in year 3 is 10 cm. Horizontal line indicates breast height.
| Table 3. Description of height growth comparison studies. | ||||
| Study | Treatment | Location | Site type | Average annual height growth |
| This study | Gap cutting | Northern Finland | Herb-rich drained peatland site a) | 7.1 cm 5-year mean for 41 cm seedlings (3rd to 7th year after cut) |
| Cajander (1934) | Gap cutting | Southern Finland | Oxalis-Myrtillus mineral soil site b) | 8.8 cm for 41–60 cm seedlings (3rd to 7th year after cut) |
| Complete overstory removal | 21.1 cm for 41–60 cm seedlings (3rd to 7th year after cut) | |||
| Koistinen and Valkonen (1993) | Complete removal of overstory | Southern Finland | Oxalis-Myrtillus and Myrtillus mineral soil site b) | 20 cm (first 9 year mean) for 2.7 m tall seedlings |
| Örlander and Karlsson (2000) | Variable intensity removal of overstory by shelter tree cutting | Southern Sweden | Drained productive shallow-peated mineral soil site | 11–12 cm (first 8 year mean) for 20–50 cm seedlings with overstory density of 160 stems ha–1 or less |
| Nilson and Lundqvist (2001) | Variable intensity (30, 60, 85%) thinning of overstory from above or below | Northern and central Sweden | Vaccinium myrtillus low herb site and tall herb mineral soil site | 2–15 cm (first 7 year mean) for > 50cm seedlings depending on overstory density, time since cutting, and location |
| Eerikäinen et al. (2014) | Uneven-aged cutting | Southern Finland | Oxalis-myrtillus and Myrtillus mineral soil site | 1–4 cm (first 15 year mean) depending on tree size and time |
| Siipilehto et al. (2014) | Spruce plantation | Whole of Finland | Herb-rich, Vaccinium myrtillus and Vaccinium vitis-idaea drained peatland sites a) | 11.9 cm (first 9.2 year mean) c) |
| a) According to Laine et al. (2012) b) According to Cajander (1926) c) Calculated by dividing mean height (1.1 m) by mean age of plantations (9.2 years) in Siipilehto et al. (2014) data. | ||||