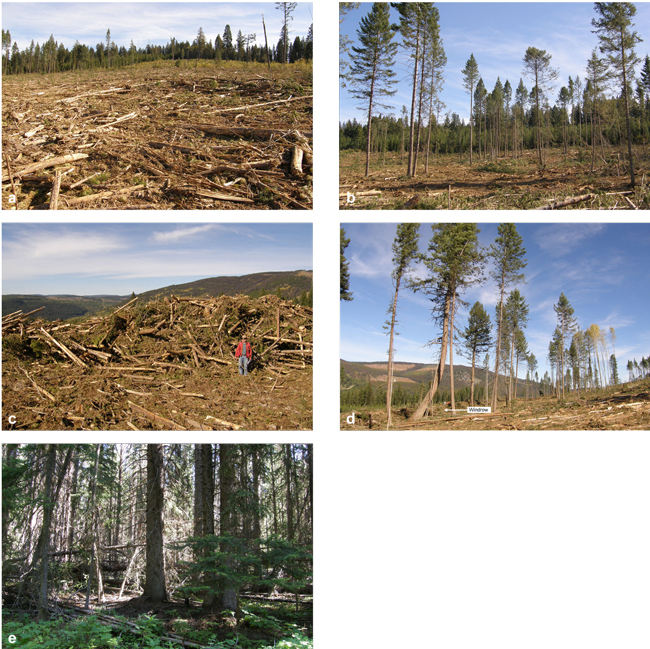
Fig. 1. Photographs (fall 2009) of treatment sites (a) dispersed woody debris, (b) dispersed woody debris with green-tree retention, (c) windrows of woody debris, (d) windrows of woody debris with green-tree retention, and (e) uncut old forest.
| Table 1. Mean (n = 3 study areas) ± SE diameter (cm), height (m), and stand density of overstory (≥ 20 m height) coniferous trees, measurements of woody debris treatments, and results of analyses. Mean values followed by different letters are significantly different by DMRT. | |||||||
| Parameter and species | DISP | DISP+GTR | WINDR | WINDR+GTR | FOREST | Analysis | |
| Overstory conifers | |||||||
| Mean diameter | |||||||
| Pseudotsuga menziesii | - | 48.2 ± 1.9 | - | 46.3 ± 4.3 | 38.1 ± 3.5 | - | - |
| Mean height | |||||||
| Pseudotsuga menziesii | - | 30.9 ± 1.0 | - | 29.6 ± 1.2 | 29.2 ± 2.4 | - | - |
| Trees/ha | - | 5–15 | - | 5–15 | 340 ± 87 | - | - |
| F3,6 | P | ||||||
| Area (ha) | 4.47 ± 0.23 | 4.63 ± 0.03 | 5.83 ± 1.34 | 5.77 ± 1.38 | 100+ | 0.92 | 0.49 |
| Woody debris | |||||||
| Total volume (m3) | 735b ± 106 | 1084b ± 257 | 2504a ± 483 | 2996a ± 296 | - | 21.76 | <0.01 |
| Volume/ha (m3) | 167.9b ± 33.8 | 234.4b ± 56.5 | 504.1a ± 165.3 | 589.3a ± 148.3 | - | 6.81 | 0.02 |
| F1,2 | P | ||||||
| Windrow length (m) | - | - | 256.1 ± 22.6 | 411.7 ± 77.8 | - | 6.85 | 0.12 |
| Volume (m3) per m of windrow | - | - | 10.23 ± 2.62 | 8.06 ± 2.14 | - | 1.18 | 0.39 |
| Windrow height (m) | - | - | 2.26 ± 0.34 | 2.01 ± 0.35 | - | 6.81 | 0.12 |
| Windrow width (m) | - | - | 8.03 ± 0.97 | 7.32 ± 0.83 | - | 0.43 | 0.58 |
| DISP = Dispersed debris; DISP+GTR = Dispersed debris and green-tree retention; WINDR = Windrow of debris; WINDR+GTR = Windrow of debris and green-tree retention. | |||||||
| Table 2. Mean ± SE (n = 3 or 5 samples) total abundance, species richness, and diversity of small mammals during 2010–2012 and results of RM-ANOVA for each block (study area). Within a row, columns with different letters are significantly different by Duncan’s multiple range test (DMRT), adjusted for multiple contrasts. No data were found to be correlated among years. View in new window/tab. |
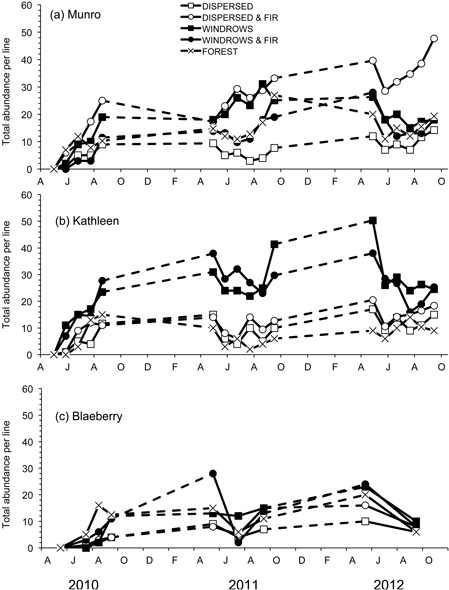
Fig. 2. Total abundance per line of forest-floor small mammals for the five treatments for each of the study sites: a) Munro, b) Kathleen, and c) Blaeberry 2010 to 2012. A = April, J = June, A = August, O = October, D = December, F = February.
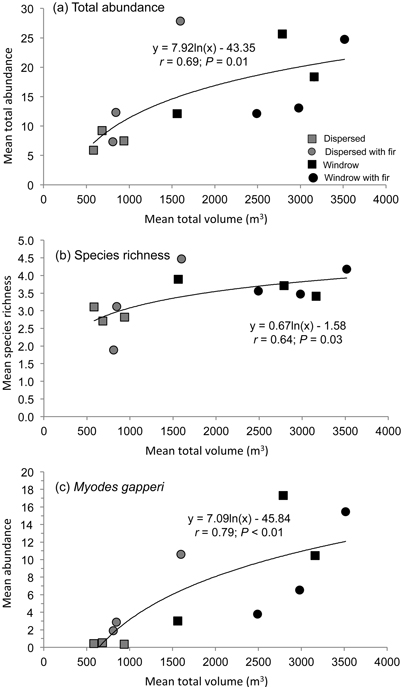
Fig. 3. Regression relationship of mean a) total abundance and b) species richness of forest-floor small mammals, and c) abundance of Myodes gapperi, with mean total volume of woody debris in dispersed and windrow treatments with and without GTR.
| Table 3. Mean ± SE (n = 3 or 5 samples) abundance per line, number of recruits, successful pregnancies, and early juvenile survival for Myodes gapperi during 2010–2012 and results of RM-ANOVA for each block (study area). F-values identified by * were calculated using an H-F correction factor, which decreased the stated degrees of freedom due to correlation among repeated measures. Within a row, columns of mean values with different letters are significantly different by Duncan’s multiple range test (DMRT), adjusted for multiple contrasts. View in new window/tab. |
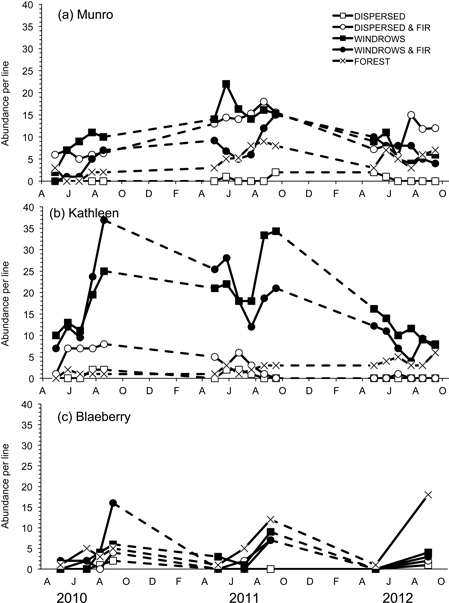
Fig. 4. Abundance per line of Myodes gapperi for the five treatments for each of the study sites: a) Munro, b) Kathleen, and c) Blaeberry 2010 to 2012. A = April, J = June, A = August, O = October, D = December, F = February.
| Table 4. Responses (overall mean values ± SE, n = 9; 3 study areas × 3 years) of small mammal communities to GTR and woody debris treatments 2010–2012. | |||||
| Parameter | Dispersed | Dispersed+GTR | Windrow | Windrow+GTR | Uncut forest |
| Mean abundance per line | |||||
| Myodes gapperi | 0.43 ± 0.12 | 5.08 ± 1.61 | 10.15 ± 2.50 | 8.40 ± 2.23 | 4.35 ± 0.91 |
| Peromyscus maniculatus | 2.07 ± 0.55 | 3.80 ± 0.76 | 1.55 ± 0.74 | 1.80 ± 0.83 | 3.95 ± 0.91 |
| Neotamias amoenus | 3.03 ± 0.87 | 4.89 ± 1.62 | 2.34 ± 0.71 | 2.28 ± 0.73 | 1.68 ± 0.76 |
| Phenacomys intermedius | 0.34 ± 0.11 | 0.02 ± 0.02 | 0.15 ± 0.11 | 0.36 ± 0.26 | 0.16 ± 0.07 |
| Microtus longicaudus | 0.53 ± 0.28 | 0.80 ± 0.61 | 2.61 ± 0.82 | 1.97 ± 0.65 | 0.74 ± 0.50 |
| Microtus pennsylvanicus | 0.45 ± 0.33 | 0.56 ± 0.27 | 0.00 ± 0.00 | 0.07 ± 0.07 | 0.06 ± 0.06 |
| Sorex monticolus | 0.58 ± 0.16 | 0.32 ± 0.17 | 1.45 ± 0.22 | 0.79 ± 0.19 | 0.29 ± 0.14 |
| Sorex cinereus | 0.14 ± 0.05 | 0.15 ± 0.09 | 0.51 ± 0.20 | 0.57 ± 0.20 | 0.26 ± 0.15 |
| Mustela erminea | 0.04 ± 0.02 | 0.04 ± 0.04 | 0.05 ± 0.04 | 0.16 ± 0.07 | 0.04 ± 0.03 |
| Total | 7.61 ± 0.74 | 15.66 ± 3.58 | 18.81 ± 2.50 | 16.40 ± 2.38 | 11.53 ± 1.23 |
| Species richness | 2.89 ± 0.15 | 3.14 ± 0.43 | 3.70 ± 0.30 | 3.72 ± 0.21 | 3.01 ± 0.27 |
| Species diversity | 1.16 ± 0.07 | 1.19 ± 0.16 | 1.39 ± 0.16 | 1.51 ± 0.17 | 1.29 ± 0.13 |
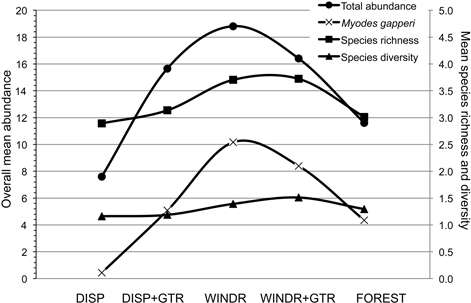
Fig. 5. Overall mean (n = 9; 3 study areas × 3 years) abundance for total small mammals and Myodes gapperi and species richness and diversity for the five treatments 2010 to 2012. DISP = Dispersed, DISP+GTR = Dispersed with green tree retention, WINDR = Windrow, WINDR+GTR = Windrow with green tree retention.