| Table 1. The location, code, and percentage of females in the studied populations and the number of male and female Taxus baccata individuals analysed. | |||||
| Population | Pop. Number | Longitude/Latitude | % females a | Analyzed males | Analyzed females |
| Leszno | 1 | 53°46´N/20°52´E | 45 | 50 | 50 |
| Choczewskie Cisy | 2 | 54°46´N/17°45´E | 47 | 36 | 46 |
| Cisy nad Czerską Strugą | 3 | 53°45´N/17°57´E | 46 | 40 | 47 |
| Jelenia Góra | 4 | 53°35´N/18°06´E | 50 | 38 | 36 |
| Wierzchlas | 5 | 53°30´N/18°06´E | 33 | 50 | 50 |
| Cisy w Czarnem | 6 | 53°44´N/16°58´E | 49 | 48 | 48 |
| Cisy Rokickie | 7 | 53°45´N/14°51´E | 64 | 49 | 50 |
| Nadleśnictwo Rokita | 8 | 53°42´N/14°51´E | 63 | 25 | 46 |
| Boleszkowice | 9 | 52°42´N/14°33´E | 55 | 37 | 55 |
| Bogdaniec | 10 | 52°41´N/15°04´E | 32 | 32 | 32 |
| Książ | 11 | 50°50´N/16°16´E | 37 | 43 | 37 |
| Cisowa Góra | 12 | 50°32´N/16°42´E | 53 | 50 | 50 |
| Cisy koło Barda | 13 | 50°32´N/16°39´E | 51 | 50 | 50 |
| Nowy Waliszów | 14 | 50°18´N/16°45´E | 51 | 50 | 50 |
| Cisy nad Liswartą | 15 | 50°44´N/18°46´E | 54 | 34 | 55 |
| Cisy w Hucie Starej | 16 | 50°33´N/19°12´E | 48 | 26 | 27 |
| Jasień | 17 | 50°59´N/19°33´E | 55 | 41 | 52 |
| Radomice | 18 | 50°44´N/20°39´E | 68 | 29 | 65 |
| Mogilno | 19 | 49°39´N/20°49´E | 58 | 38 | 53 |
| Wadernik | 20 | 49°29´N/21°38´E | 51 | 26 | 30 |
| Igiełki | 21 | 49°30´N/21°38´E | 54 | 30 | 39 |
| Kretówki | 22 | 49°44´N/21°53´E | 40 | 58 | 39 |
| Malinówka | 23 | 49°41´N/21°55´E | 44 | 50 | 50 |
| Pasmo Łysej Góry | 24 | 49°33´N/21°34´E | 55 | 42 | 41 |
| Serednica | 25 | 49°28´N/22°31´E | 46 | 31 | 26 |
| Cisy na Górze Jawor | 26 | 49°17´N/22°17´E | 55 | 38 | 34 |
| a Based on data collected by Kostrzyca Forest Gene Bank | |||||
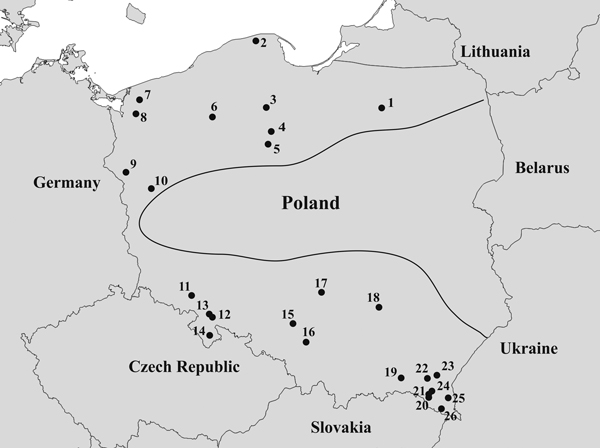
Fig. 1. Map of the geographical locations of the 26 Taxus baccata populations included in this study. Codes representing the named populations are listed in Table 1, and the borders of the natural T. baccata distribution in Poland are indicated with a black line.
| Table 2. Parameters used to estimate the genetic structure of the studied Taxus baccata populations averaged across five nSSR loci. A – average number of alleles, AR25 –allelic richness, He – expected heterozygosity, Ho – observed heterozygosity, N0 – null allele frequency. View in new window/tab. |
| Table 3. Parameters used to estimate the level of genetic diversity and differentiation in male and female individuals A – average number of alleles, AR25 – allelic richness, He – expected heterozygosity, Ho – observed heterozygosity, N0 – null allele frequency, Fst –genetic differentiation, p–values of the statistical significance of differences between the two sample groups. | |||
| Parameter | Female samples | Male samples | p-value |
| A | 9.512 | 9.469 | 0.945 |
| AR25 | 7.769 | 7.744 | 0.965 |
| He | 0.730 | 0.731 | 0.911 |
| Ho | 0.479 | 0.487 | 0.876 |
| N0 | 0.146 | 0.137 | 0.275 |
| Fst | 0.149 | 0.152 | 0.901 |
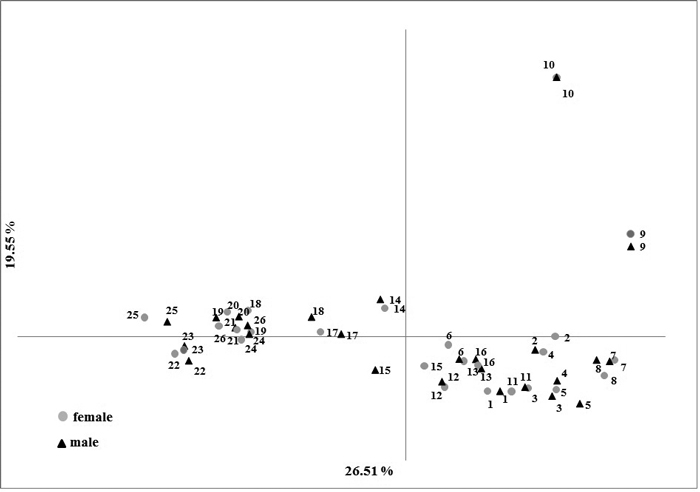
Fig. 2. Results of Principal Component Analysis based on five nuclear SSR markers in male and female Taxus baccata individuals.