| Table 1. Mean dimensions of sampled trees and statistics of TRW (tree-ring width) datasets: number of measured and crossdated time-series; range, agreement (interseries correlation, first order autocorrelation, GLK (Gleichläufigkeit) and EPS (expressed population signal)) and mean sensitivity of crossdated tree time-series of beech and larch. | ||
| Beech | Larch | |
| Studied period | 1949–2012 | 1911–2012 |
| Number of samples | 18 | 44 |
| Number of crossdated samples | 18 | 38 |
| Number of crossdated trees | 9 | 20 |
| Mean tree height, m | 28.3 | 32.2 |
| Standard deviation of tree height, m | 4.26 | 3.17 |
| Mean tree diameter at breast height, cm | 41.5 | 48.7 |
| Standard deviation of diameter at breast height, cm | 6.3 | 10.7 |
| Min TRW, mm | 0.30 | 0.23 |
| Max TRW, mm | 6.63 | 13.22 |
| Mean TRW, mm | 2.80 | 2.40 |
| Standard deviation of TRW, mm | 1.01 | 1.62 |
| Interseries correlation | 0.69 | 0.60 |
| First order autocorrelation | 0.61 | 0.76 |
| Mean sensitivity | 0.22 | 0.29 |
| GLK | 0.70 | 0.64 |
| EPS | 0.88 | 0.91 |
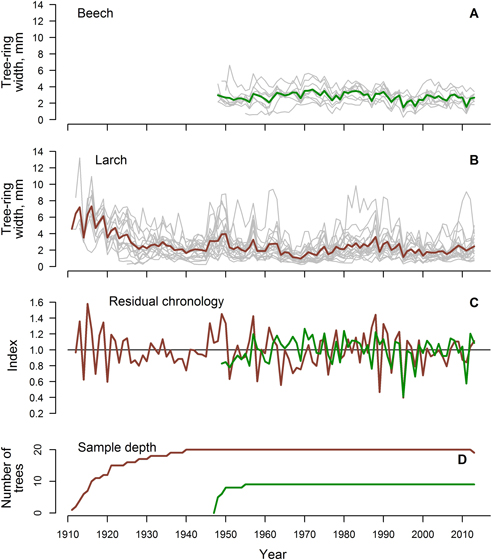
Fig. 1. Crossdated time series of TRW of beech (A) and larch (B), residual chronologies (C) and sample depth (D) (in C and D, green line represents beech and red line represents larch).
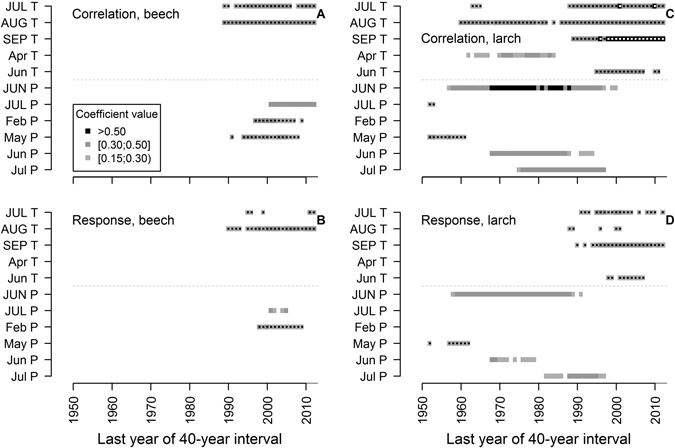
Fig. 2. Significant (p-value < 0.05) Pearson correlation (black bars) and response function (grey bars) coefficients between climatic variables: mean monthly temperature (T) and precipitation sums (P) and residual chronologies of beech (A) and larch (B) TRW, calculated using data for whole period (1911–2012 for larch and 1949–2012 for beech). Months in uppercase correspond to the year prior to tree-ring formation (t–1).
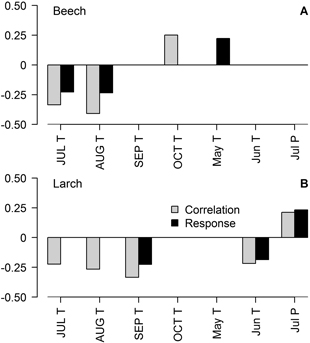
Fig. 3. Significant (p-value < 0.05) Pearson correlation and response function coefficients between climatic variables: mean monthly temperature (T) and precipitation sums (P) and residual chronologies of beech TRW (A and B, respectively) and larch (C and D, respectively) calculated for 40-year moving intervals. Months in uppercase correspond to the year prior to tree-ring formation (t–1). Dots represent negative coefficient values. Note that length of the analysed chronologies differs between species.