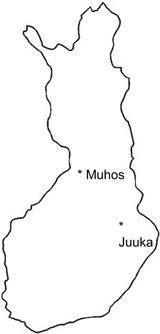
Fig. 1. Location of the experiments.
| Table 1. Fertilization treatments. Amounts of main nutrients in the treatments. | ||||||
| Code | N | P | K | Ca | Mg | |
| kg ha–1 | ||||||
| 1. | 0 | 0 | 0 | 0 | 0 | 0 |
| 2.1) | A0.5+N | 93 | 6 | 11 | 160 | 19 |
| 3.1) | A1.0+N | 93 | 13 | 21 | 319 | 38 |
| 4. | A2.5+N | 93 | 31 | 53 | 798 | 94 |
| 5. | A5.0+N | 93 | 63 | 105 | 1595 | 88 |
| 6. | A10.0+N | 93 | 125 | 210 | 3190 | 375 |
| A = Ash (P 13 g kg–1, K 21 g kg–1, Ca 319 g kg–1, Mg 37.5 g kg–1, B 226 mg kg–1, Cu 212 mg kg–1, Zn 278 mg kg–1, Mn 21 g kg–1). A0.5 = 0.5 Mg ha–1, A1.0 = 1 Mg ha–1, A2.5 = 2.5 Mg ha–1, A5.0 = 5 Mg ha–1, A 10.0 = 10 Mg ha–1. N = Urea 200 kg ha–1 (N 46.3%) 1) Treatments 2 and 3 re-fertilized in 1986 with urea (N 185 kg ha–1) and PK (P 36 kg ha–1, K 68 kg ha–1). | ||||||
| Table 2. Leafless above-ground biomass equations for three-year old alders, downy birches and willows. Equations have the form Y = aXb, and have been corrected after logarithmic transformation with se2/2. Y = dry mass (g), X = d0.1, d0.1 = basal diameter (mm), a and b = constants, R2 = coefficient of determination, N = number of sample trees. | ||||
| Species | a | b | R2 % | N |
| Alnus incana | 0.099 | 2.364 | 98.7 | 20 |
| Betula pubescens | 0.225 | 2.186 | 96.7 | 20 |
| Salix spp. | 0.089 | 2.598 | 97.8 | 20 |
| Table 3. Fertilization treatments at Juuka. The amount of main nutrients in each treatment. | ||||||
| Code | N | P | K | Ca | Mg | |
| kg ha–1 | ||||||
| 1. | 0 | 0 | 0 | 0 | 0 | 0 |
| 2. | PK | 0 | 45 | 85 | 118 | 2 |
| 3. | NPK | 93 | 45 | 85 | 118 | 2 |
| 4. | Ash3 | 0 | 74 | 242 | 663 | 108 |
| 5. | Ash3 + N | 93 | 74 | 242 | 663 | 108 |
| A = Ash 3000 kg ha–1 (P 25 g kg–1, K 81 g kg–1, Ca 221 g kg–1, Mg 36 g kg–1, B 356 mg kg–1, Cu 510 mg kg–1, Zn 2627 mg kg–1, Mn 25 g kg–1, Fe 28 g kg–1). N = Urea 200 kg ha–1 (N 46.3%) PK = PK fertilizer for peatlands 500 kg ha–1 (N 0%, P 9%, K 17%, Ca 23%, Mg 0.3%, B 0.02%) | ||||||
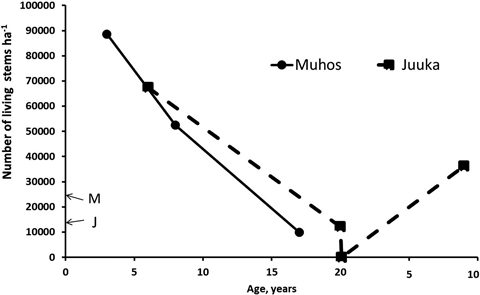
Fig. 2. Total number of living stems after clear-cutting at Muhos and Juuka. At age 0 letter M (Muhos) and J (Juuka) indicate the density of mother stands before clear-cutting. As fertilisation treatments did not affect stand density, the results are presented as means of all plots.
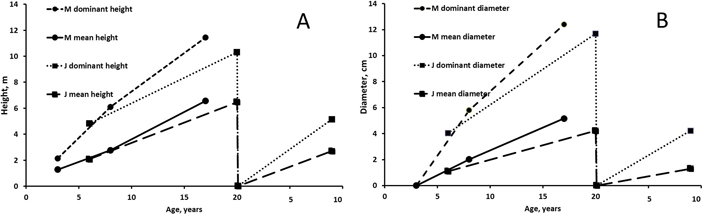
Fig. 3. Mean and dominant height (A) and mean and dominant breast height diameter (B) of alders at Muhos (M) and Juuka (J). As fertilisation did not affect tree characteristics except in one case (at Juuka after 6 years), the results are presented as means of all plots. View larger in new window/tab.
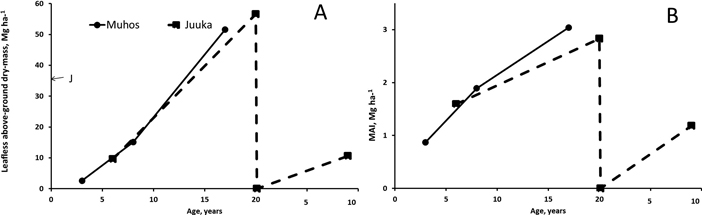
Fig. 4. Leafless above-ground biomass production (A) and mean annual leafless biomass production (B) at Muhos and at Juuka. J at age 0 marks the biomass of the mother stand at Juuka before clear-cutting. As fertilisation did not affect the biomass production, the results are presented as means of all plots. View larger in new window/tab.
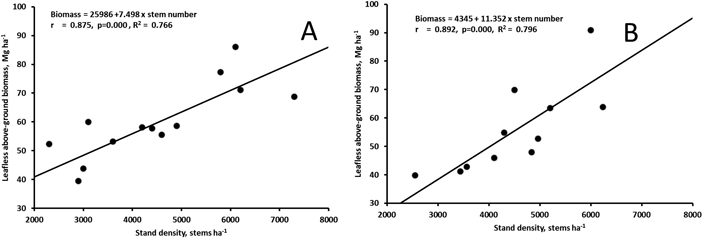
Fig. 5. Correlation between leafless above-ground biomass and the number of stems with d1.3 > 5 cm in the 17-year old stand at Muhos (A) and in the 20-year old stand at Juuka (B). View larger in new window/tab.
| Table 4. Foliar nutrient concentrations of alder sprouts at Muhos. The results are means for the leaves sampled in autumn 1984 and 1986, i.e., 5 and 7 years after the first fertilization. The treatments differing significantly from the unfertilized control (0) according to Dunnett’s test are marked with asterisks. Significance of F-values marked as * p ≤ 0.5, ** p < 0.01, *** p ≤ 0.001). | |||||||
| Nutrient | Fertilization treatments 1) | ||||||
| 0 | Ash0.5+N | Ash1+N | Ash2.5+N | Ash 5+N | Ash10+N | F-value | |
| N, mg g–1 | 29.7 | 28.4 | 31.2 | 29.9 | 30.7 | 30.4 | 0.656 |
| P, mg g–1 | 1.70 | 1.91 | 2.04 | 2.65* | 2.46* | 2.56* | 6.579** |
| K, mg g–1 | 8.45 | 7.82 | 9.05 | 8.41 | 8.06 | 9.97 | 1.453 |
| Ca, mg g–1 | 7.84 | 7.69 | 7.56 | 8.25 | 10.10* | 10.56* | 7.167** |
| Mg, mg g–1 | 2.56 | 2.65 | 2.31 | 2,93 | 2.84 | 2,91 | 3.515* |
| Mn, ppm | 812 | 806 | 652 | 395* | 338* | 289* | 15.211*** |
| Fe, mg kg–1 | 67.2 | 67.5 | 71.8 | 58.4 | 69.5 | 69.8 | 1.130 |
| Zn, mg kg–1 | 79.9 | 85.1 | 89.4 | 86.0 | 74.9 | 69.2 | 0.487 |
| Cu, mg kg–1 | 9.0 | 7.7 | 12.8 | 7.8 | 7.5 | 6.7 | 4.699* |
| B, mg kg–1 | 25.2 | 26.0 | 26.1 | 30.9 | 33.7 | 36.7 | 4.200 |
| 1) Treatments Ash 0.5 + N and Ash 1+N were re-fertilized in May 1986 with NPK. | |||||||
| Table 5. Foliar nutrient concentrations of alder sprouts at Juuka. The results are means for leaves sampled in autumn 1990 and 2000, i.e. 10 and 20 years after fertilization. The treatments differing significantly from the unfertilized control (0) according to Dunnett’s test are marked with asterisks. Significance of F-values marked as * p ≤ 0.5, ** p < 0.01, *** p ≤ 0.001). | ||||||
| Nutrient | Fertilization treatment | |||||
| 0 | PK | NPK | Ash3 | Ash3+N | F-value | |
| N, mg g–1 | 33.6 | 33.5 | 33.0 | 32.6 | 33.0 | 0.454 |
| P, mg g–1 | 1.79 | 1.92 | 2.01 | 1.67 | 1.81 | 2.208 |
| K, mg g–1 | 8.67 | 8.07 | 9.08 | 8.10 | 8.10 | 0.885 |
| Ca, mg g–1 | 6.63 | 7.15 | 5.52 | 7.08 | 6.84 | 1.082 |
| Mg, mg g–1 | 2.00 | 2.16 | 1.94 | 1.80 | 1.89 | 1.036 |
| Mn, ppm | 263 | 434 | 197 | 548* | 428 | 4.531* |
| Fe, mg kg–1 | 53.3 | 54.2 | 55.8 | 51.8 | 53.4 | 0.368 |
| Zn, mg kg–1 | 27.4 | 28.2 | 23.9 | 34.6 | 30.6 | 1.466 |
| Cu, mg kg–1 | 11.1 | 8.6 | 9.6 | 9.8 | 9.3 | 3.790* |
| B, mg kg–1 | 15.9 | 8.9 | 15.7 | 12.5 | 15.2 | 0.841 |
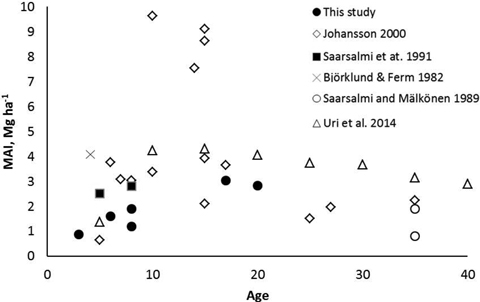
Fig. 6. Mean annual leafless above-ground biomass production (MAI) of naturally originated grey alder stands in Scandinavian and Baltic studies and in this study.