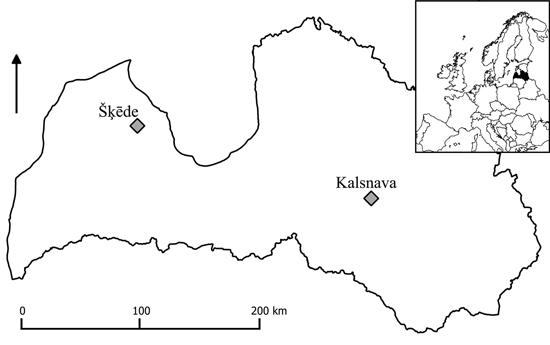
Fig. 1. Location of the studied sites (grey squares).
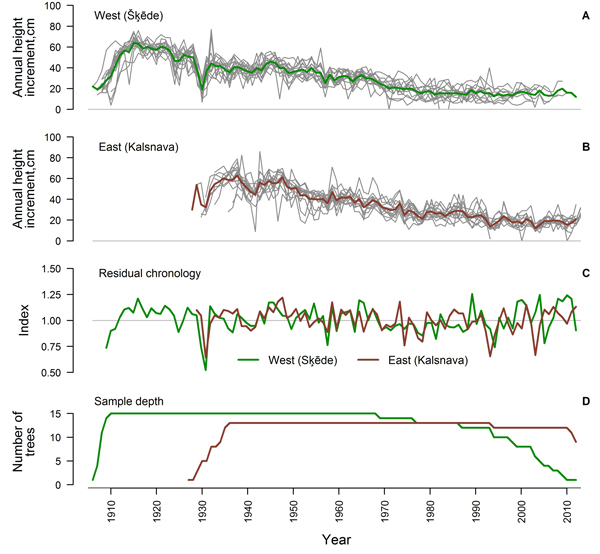
Fig. 2. Crossdated time series of annual height increment of Scots pine for the western (Šķēde) (A) and eastern (Kalsnava) (B) site (mean values shown by thick line), residual chronologies of annual height increment (C) and sample depth of the datasets (D).
| Table 1. Statistics of crossdated datasets of annual height increment (HI) of Scots pine for the western (Šķēde) and eastern (Kalsnava) site. Abbreviations: GLK – Gleichläufigkeit and EPS – expressed population signal (Wigley et al. 1984). | ||
| Western (Šķēde) | Eastern (Kalsnava) | |
| Number of crossdated time series | 15 | 13 |
| Covered period | 1906–2012 | 1927–2013 |
| Minimum HI, cm | 2 | 2 |
| Maximum HI, cm | 77 | 86 |
| Mean HI, cm | 33.21 | 34.28 |
| Standard deviation of HI, cm | 15.70 | 15.40 |
| Mean interseries correlation | 0.54 | 0.44 |
| Mean autocorrelation | 0.85 | 0.84 |
| Mean sensitivity | 0.22 | 0.21 |
| GLK | 0.58 | 0.59 |
| EPS | 0.87 | 0.85 |
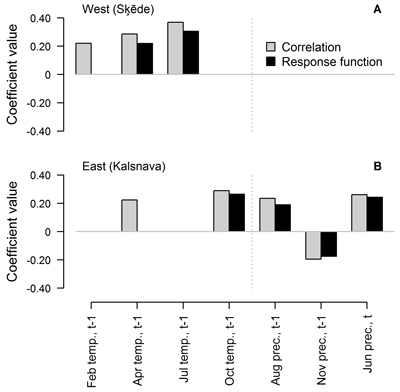
Fig. 3. Statistically significant (p-value < 0.05) Pearson correlation and response function coefficients between climatic factors (mean temperature (temp.) and precipitation sums (prec.) for the preceding (t-1) and current (t) year) and residual chronologies of annual height increment of Scots pine for the western (Šķēde) (A) and eastern (Kalsnava) (B) site. Coefficients are calculated for the entire period covered by the chronologies (from 1906 to 2012 and from 1927 to 2012 in the western and eastern site, respectively).
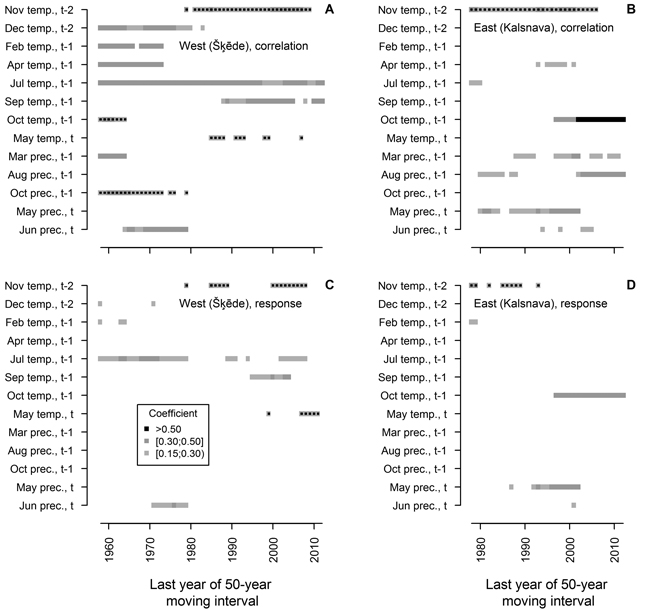
Fig. 4. Statistically significant (p-value < 0.05) Pearson correlation (A and B) and response function (C and D) coefficients calculated between climatic factors (mean temperature (temp.) and precipitation (prec.) for months) and residual chronologies of annual height increment of Scots pine for the western (Šķēde) and eastern (Kalsnava) sites, respectively. Each square represents 50-year moving interval. The dots superimposed on squares represent negative values of coefficients. Note that the length of the analysed periods differs.