| Table 1. Details of the study sites, Asa and Turbo, and experimental installations. | ||
| Asa | Turbo | |
| Latitude / longitude | 57°08´N / 14°47´E | 60°14´N / 15°51´E |
| Altitude (m amsl) | 235 | 195 |
| Aspect / topography | east /gentle slope | west / gentle slope |
| Soil type | podzolized sandy-silty till | podzolized silty till |
| C/N in mor layera | 29.9 (26.7) | 27.5 (25.5) |
| Mean precipitation (mm year–1)b | 664 | 581 |
| Annual mean air temperature (°C)b | 5.3 | 5.0 |
| Open-field deposition (mean for 1994–2000)c (kg ha–1 year–1) | ||
| NO3--N | 3.8 | 2.0 |
| NH4+-N | 3.4 | 1.9 |
| SO42--S | 5.2 | 3.0 |
| Cl- | 12 | 2.7 |
| Na++K++Mg2++Ca2+ | 12 | 4.4 |
| Site quality class (m3 ha–1 year–1) | 11.3 | 8.4 |
| Tree species composition of the harvested stand, by basal area | P. abies (100%) | P. abies (71%) & Pinus sylvestris L. (29%) |
| Date of harvest | 23–24 April, 2001 | Shift May-June, 2001 |
| Date of residue treatment | 3 May, 2001 | 31 May, 2001 |
| Date of installation of suction cups and funnelsd | Late April, 2001 | Early May, 2001 |
| aMeasured in 2006 and, shown within parentheses, in 2008. bData from nearby meteorological stations (Alexandersson and Eggertsson Karlström 2001). cData from nearby monitoring stations (http://www.krondroppsnatet.ivl.se/). dFunnels were installed at Asa only. | ||
| Table 2. Studied treatments at the Asa and Turbo sites. Logging residues (LR) include tops and branches with needles. The stand-specific amount of LR (1LR) is defined as the estimated LR amount per hectare of the harvested tree stand spread on one hectare of the ground. The treatments 2LR and 4LR refer to, respectively, two and four times that amount. For the needle treatments, the amounts of needles, calculated according to Marklund (1988), are presented within parentheses. | |||
| Treatment | Abbreviation | Added amount of logging residues in 2001 (kg m-2 dry matter) | |
| Asa | Turbo | ||
| LR harvested | 0LR | 0 | 0 |
| 1×stand-specific amount of LR | 1LR | 4.4 | 5.0 |
| Needles from 1×stand-specific amount of LR (tops and branches were removed after about 20 weeks)a | 1Needle_20 | 4.4 (1.5) | 5.0 (1.6) |
| 2×stand-specific amount of LR | 2LR | 8.8 | 9.9 |
| 4×stand-specific amount of LR | 4LR | 17.6 | 19.8 |
| Needles from 8×stand-specific amount of LR (tops and branches were removed after about 7 weeks)a | 8Needle_7 | 35.2 (11.6) | 39.6 (12.6) |
| Needles from 8×stand-specific amount of LR (tops and branches were removed after about 20 weeks)a | 8Needle_20 | 35.2 (11.6) | 39.6 (12.6) |
| aThe added amounts of needles were less than the presented total amounts, i.e. significant amounts of needles were removed with the tops and branches after storage on the study plots. In the 8Needle_7 and 8Needle_20 treatments, less than 30% of the total amount remained on the ground after removing the LR. | |||
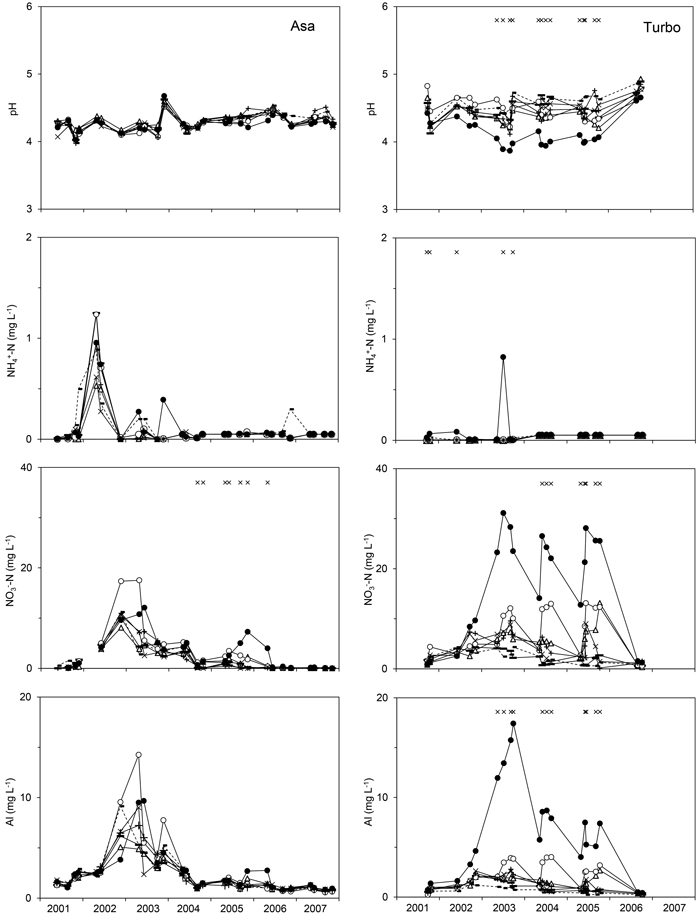
Fig. 1. pH and the concentration of NO3--N, NH4+-N or Al in the soil water representing the logging-residue treatments studied at Asa (left) and Turbo (right) after application of the logging residues. The graphs show least-square means for each sampling occasion obtained by running Model 1 on untransformed concentrations or pH. Study year is presented on the x-axis. 0LR (--■--), 1LR (─∆─), 1Needle_20 (─▬─), 2LR (─○─), 4LR (─●─), 8Needle_7 (─×─), 8Needle_20 (─ + ─). × indicates sampling occasions at which a significant effect of treatment was detected. View larger in new window/tab.
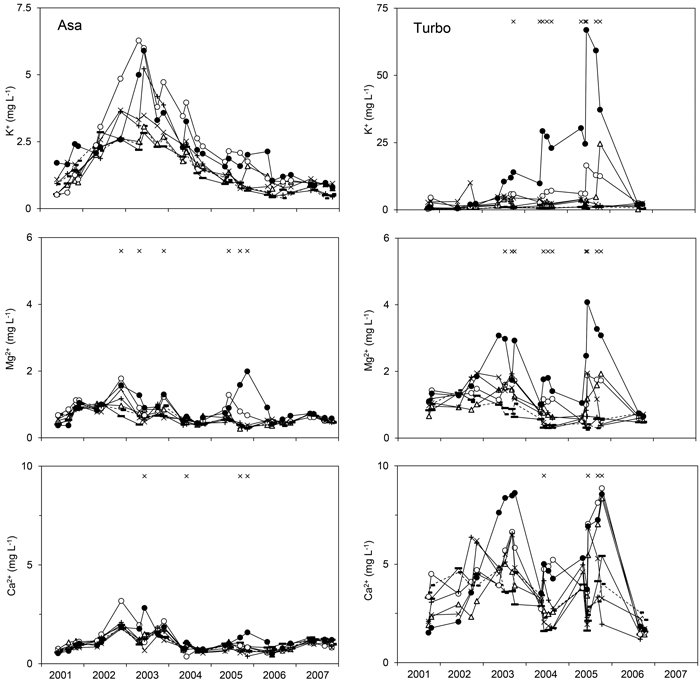
Fig. 2. Concentration of K+, Mg2+, or Ca2+ in the soil water representing the logging-residue treatments studied at Asa (left) and Turbo (right) after application of the logging residues. Note the different scales on the y-axis for the K+ concentration. The graphs show least-square means for each sampling occasion obtained by running Model 1 on untransformed concentrations except for the Ca2+ concentration at Asa which were reconverted from logarithmic values. Study year is presented on the x-axis. 0LR (--■--), 1LR (─∆─), 1Needle_20 (─▬─), 2LR (─○─), 4LR (─●─), 8Needle_7 (─×─), 8Needle_20 (─ + ─). × indicates sampling occasions at which a significant effect of treatment was detected. View larger in new window/tab.
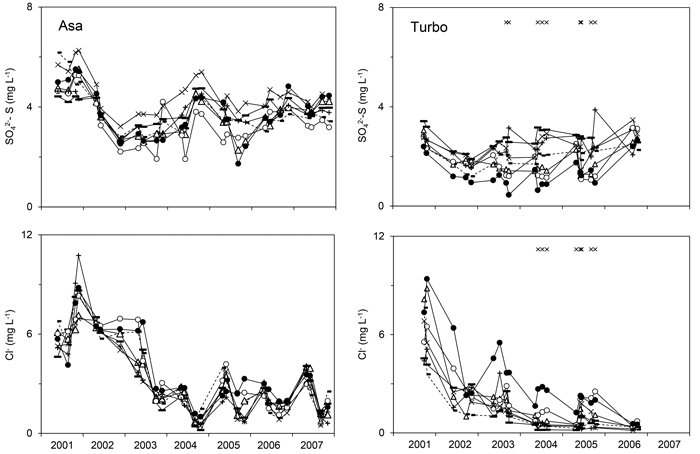
Fig. 3. Concentration of SO42--S or Cl- in the soil water representing the logging-residue treatments studied at Asa (left) and Turbo (right) after application of the logging residues. The graphs show least-square means for each sampling occasion obtained by running Model 1 on untransformed concentrations. Study year is presented on the x-axis. 0LR (--■--), 1LR (─∆─), 1Needle_20 (─▬─), 2LR (─○─), 4LR (─●─), 8Needle_7 (─×─), 8Needle_20 (─ + ─). × indicates sampling occasions at which a significant effect of treatment was detected. View larger in new window/tab.
| Table 3. Results from the linear mixed models (Model 1) used to determine effects of treatment, time and the interaction between treatment and time for the studied soil-solution variables; number of observations and p-values according to Model 1. | ||||||||
| Variable | Number of observations, n | p-values for effect of treatment, αi | p-values for effect of time, τk | p-values for interaction between treatment and time, (ατ)ik | ||||
| Asa | Turbo | Asa | Turbo | Asa | Turbo | Asa | Turbo | |
| Electrical conductivity | 629 | 266 | 0.36 | <0.0001 | <0.0001 | <0.0001 | 0.25 | <0.0001 |
| H+ | 735 | 490 | 0.56 | 0.0015 | <0.0001 | <0.0001 | 0.56 | <0.0001 |
| K+ | 736 | 490 | 0.77 | 0.0048 | <0.0001 | <0.0001 | 0.90 | <0.0001 |
| Mg2+ | 736 | 490 | 0.21 | 0.0005 | <0.0001 | <0.0001 | 0.025 | <0.0001 |
| Ca2+ | 736 | 490 | 0.68 | 0.57 | <0.0001 | <0.0001 | 0.042 | <0.0001 |
| Al | 735 | 489 | 0.98 | 0.026 | <0.0001 | <0.0001 | 0.28 | 0.0022 |
| Cd | 386 | 214 | 0.46 | 0.0049 | <0.0001 | 0.0006 | 0.19 | 0.049 |
| Zn | 579 | 218 | 0.21 | 0.0043 | <0.0001 | <0.0001 | 0.46 | 0.40 |
| NH4+-N | 734 | 487 | 0.30 | 0.028 | <0.0001 | <0.0001 | 0.39 | 0.0048 |
| NO3--N | 710 | 487 | 0.0039 | 0.0013 | <0.0001 | <0.0001 | 0.0002 | 0.0009 |
| SO42--S | 735 | 485 | 0.65 | 0.014 | <0.0001 | <0.0001 | 0.29 | <0.0001 |
| Cl- | 735 | 485 | 0.028 | 0.0008 | <0.0001 | <0.0001 | 0.84 | 0.020 |
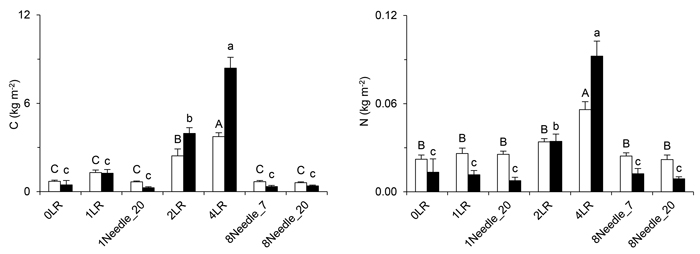
Fig. 4. The stores of C (left) and N (right) in the superficial layer of the studied treatments seven years after application of the logging residues. The superficial layer included remaining logging residues, ground vegetation and all other material above the mor layer. Significant effects of treatment within site are denoted by different letters. Open bars/capitals = Asa, closed bars/lower-case letters = Turbo, error bars = standard error. View larger in new window/tab.
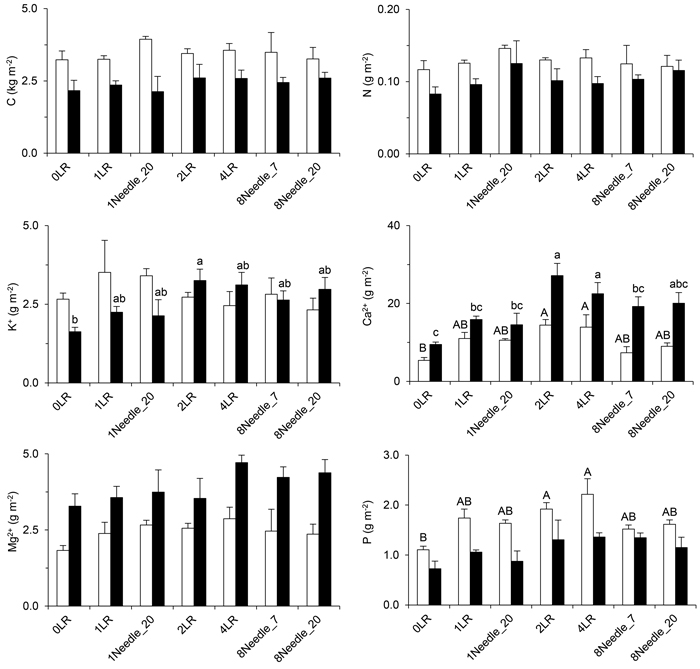
Fig. 5. The stores of total C, total N, and exchangeable K+, Mg2+, Ca2+ and P in the mor layer and 0–20 cm of the mineral soil of the studied treatments seven years after application of the logging residues. Significant effects of treatment within site are denoted by different letters. If no significant treatment effect was detected, no letters are presented. Open bars/capitals = Asa, closed bars/lower-case letters = Turbo, error bars = standard error. View larger in new window/tab.
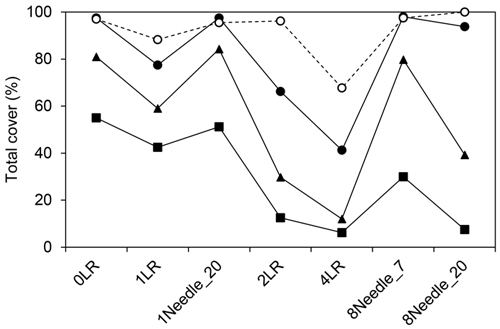
Fig. 6. Total cover of the ground vegetation (least-square means) representing the studied logging-residue treatments (on the x-axis) at Turbo on 27 Aug. 2002 (-■-), 5 Sep. 2003 (-▲-) and 6 Aug. 2006 (-●-), and at Asa on 9 Sep. 2006 (- -○- -).