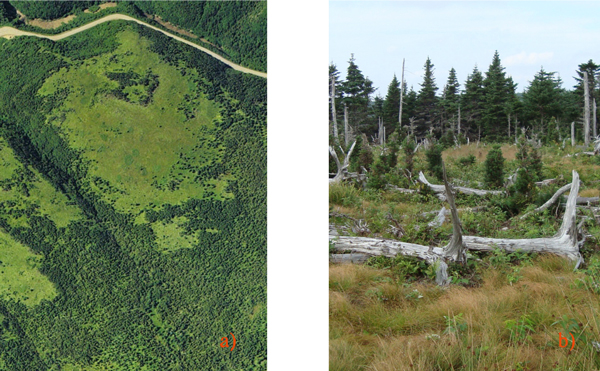
Fig. 1. Examples of spruce budworm-induced edges: a) an aerial photograph of the fragmented landscape and b) an example of an edge at one of our sites. In a), the areas devoid of continuous canopy were the result of tree mortality caused by the last spruce budworm outbreak (1974–1984) in northern Cape Breton, Canada; photography credit to Nova Scotia Department of Natural Resources (2009). In b), the insect disturbed area in the foreground is characterized by deadwood abundance and stunted saplings while the relatively intact forest is in the background; photography credit to Caroline Franklin.
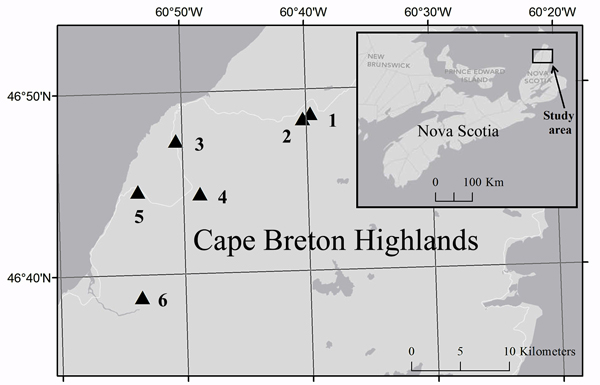
Fig. 2. Location of study sites (triangles) in Cape Breton Highlands National Park and the corresponding location in Nova Scotia (inset). Cartography credit to Caroline Franklin, Esri, DeLorme, NAVTEQ.
| Table 1. Characteristics of spruce budworm-induced forest edges and adjacent areas disturbed by a spruce budworm outbreak 30 years earlier in boreal forest of northern Cape Breton Island, Nova Scotia, Canada. | |||
| Transect | Edge orientation facing the disturbed area | Elevation (m) | Size of disturbed area (ha) |
| 1 | 234° | 438 | 4.46 |
| 2 | 292° | 465 | 5.18 |
| 3 | 341° | 352 | 4.96 |
| 4 | 60° | 422 | 3.17 |
| 5 | 270° | 381 | 6.81 |
| 6 | 12° | 459 | 4.86 |
| Table 2. Magnitude and distance of edge influence (MEI, DEI) and magnitude and distance of forest influence (MFI, DFI) for different response variables at spruce budworm outbreak-induced forest edges (n = 6). MEI/MFI is a measure of the strength (–1 to 1) to which the response variable differs at the edge compared to the reference ecosystem, which is the forest for edge influence and disturbed area for forest influence. Positive and negative MEI/MFI indicate higher and lower values at the edge (0 m) compared to the reference interior, respectively. DEI/DFI represents the set of distances from the edge over which the response variable is significantly different compared to the reference ecosystem. Negative values of DEI/DFI refer to distances from the edge into the disturbed area and ‘ns’ = not significant. | |||||
| Response Variable | Edge Influence | Forest Influence | |||
| MEI | DEI (m) | MFI | DFI (m) | ||
| Canopy cover | –0.35 | –60 to 0 | 0.99 | –20 to 60 | |
| Maximum tree height | 0.02 | –40 to –20 | 0.33 | ns | |
| Live stem density | |||||
| Abies balsamea | –0.15 | –60 to –40 | 0.99 | –20 to 60 | |
| Betula papyrifera | 0 | ns | –1 | ns | |
| Picea glauca | –0.78 | –60 to 0 | 0.83 | 0 to 60 | |
| Larix laricina | –1 | ns | 0 | ns | |
| Total | –0.42 | –60 to 0 | 0.88 | –20 to 60 | |
| Tree species diversity | 0.23 | –60 to –20 | 0.67 | 0 to 10 | |
| Snag proportion (of live and dead stems) | |||||
| Lightly decayed | –0.39 | –60 to 0 | 0.01 | ns | |
| Moderately decayed | 0.44 | –10 to 0 | 0.29 | ns | |
| Severely decayed | –0.29 | ns | –0.71 | ns | |
| Total | 0.13 | –60 to –40 | –0.10 | ns | |
| Snag breakage | 0.05 | ns | –0.05 | ns | |
| Log abundance | |||||
| Lightly decayed | –0.71 | ns | –0.33 | ns | |
| Moderately decayed | 0.07 | –40 to –20 | –0.25 | ns | |
| Severely decayed | 0.18 | ns | 0.21 | ns | |
| Total | 0.03 | ns | –0.13 | ns | |
| Structural diversity | |||||
| Tree | –0.05 | –60 to –10 | 1 | –20 to 60 | |
| Snag | –0.11 | –60 to –40 | 0.76 | –40 to 60 | |
| Log | –0.05 | ns | –0.04 | ns | |
| Total | 0 | ns | 0.27 | –10 to 60 | |
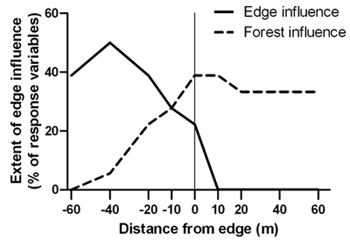
Fig. 3. Percentage of 18 structural response variables with significant edge and forest influence compared to the forest and disturbed area references, respectively, at forest edges created by a spruce budworm outbreak. Sample size was n = 6 transects.
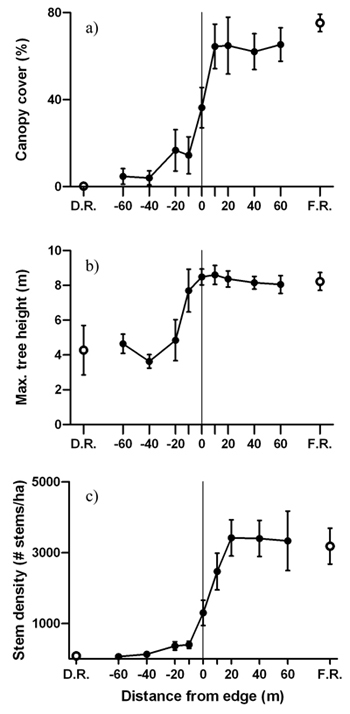
Fig. 4. Mean (± 1 SE) values for a) canopy cover, b) maximum tree height and c) live stem density along the insect disturbed area-forest edge. Open circles represent values for the disturbed area reference (D.R.) and forest reference (F.R.). Sample size was n = 6 transects.
| Table 3. Mean (± 1 SE) diameter at breast height, stem density of individual species and species diversity at different distances from the spruce budworm disturbed area-forest edge. Negative values represent the distances from the edge on the disturbed side. | ||||||
| Distance from edge (m) | Diameter at breast height (cm) | Stem density (#/ha) | Tree species diversity | |||
| Abies balsamea | Picea glauca | Betula papyrifera | Larix laricina | |||
| Disturbed reference | 11.2 ± 2.0 | 7 ± 7 | 20 ± 15 | 60 ± 38 | 0 ± 0 | 0.09 ± 0.06 |
| –60 | 10.1 ± 1.4 | 50 ± 50 | 17 ± 17 | 0 ± 0 | 0 ± 0 | 0.00 ± 0.00 |
| –40 | 6.9 ± 0.8 | 100 ± 100 | 33 ± 21 | 0 ± 0 | 0 ± 0 | 0.00 ± 0.00 |
| –20 | 13.6 ± 1.4 | 283 ± 145 | 83 ± 54 | 0 ± 0 | 0 ± 0 | 0.00 ± 0.00 |
| –10 | 15.5 ± 1.6 | 283 ± 101 | 117 ± 83 | 0 ± 0 | 0 ± 0 | 0.10 ± 0.10 |
| 0 | 11.5 ± 0.6 | 1083 ± 376 | 217 ± 75 | 0 ± 0 | 0 ± 0 | 0.46 ± 0.11 |
| 10 | 12.2 ± 0.4 | 1750 ± 530 | 717 ± 341 | 0 ± 0 | 0 ± 0 | 0.43 ± 0.14 |
| 20 | 10.4 ± 0.3 | 2250 ± 706 | 1167 ± 528 | 0 ± 0 | 0 ± 0 | 0.35 ± 0.12 |
| 40 | 9.6 ± 0.2 | 2167 ± 685 | 1183 ± 561 | 0 ± 0 | 50 ± 50 | 0.31 ± 0.13 |
| 60 | 10.0 ± 0.3 | 2067 ± 1037 | 1200 ± 636 | 17 ± 17 | 50 ± 50 | 0.43 ± 0.14 |
| Forest reference | 9.9 ± 0.3 | 1458 ± 545 | 1717 ± 587 | 0 ± 0 | 8 ± 8 | 0.28 ± 0.10 |
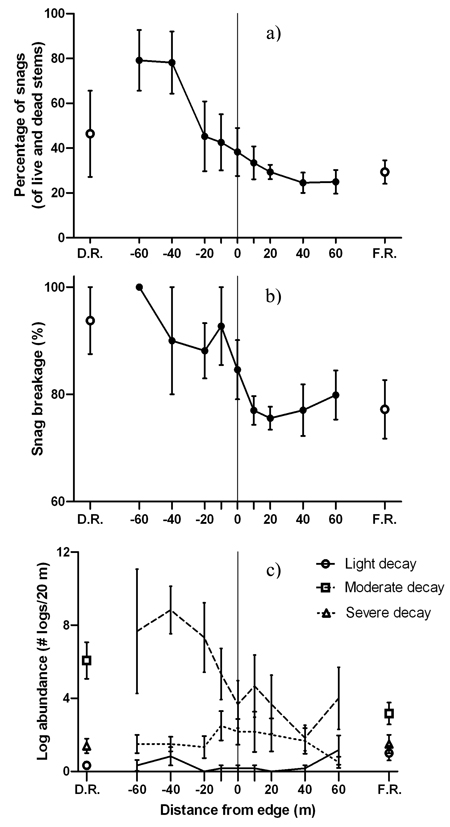
Fig. 5. Mean (± 1 SE) values for a) snags as a percentage of live and dead stems, b) snag breakage and c) log abundance by decay class along the insect disturbed area-forest edge. Open shapes represent values for disturbed area reference (D.R.) and forest reference (F.R.). Sample size was n = 6 transects.
| Table 4. Mean (± 1 SE) percentage of snags (of all snags at that distance) and snag diameter at breast height of each decay class at different distances from the spruce budworm disturbed area-forest edge. Sample size was n = 6 transects. | ||||||
| Distance from edge (m) | Percentage of snags | Snag diameter at breast height (cm) | ||||
| Light decay | Moderate decay | Severe decay | Light decay | Moderate decay | Severe decay | |
| Disturbed reference | 28 ± 16 | 36 ± 22 | 36 ± 22 | 13.1 ± 5.7 | 16.6 ± 6.6 | 17.8 ± 5.8 |
| –60 | 23 ± 17 | 37 ± 20 | 40 ± 20 | 7.0 ± 1.4 | 15.6 ± 4.7 | 12.4 ± 2.1 |
| –40 | 10 ± 10 | 43 ± 19 | 47 ± 23 | 16.5 ± 0.00 | 9.0 ± 1.5 | 16.1 ± 2.4 |
| –20 | 21 ± 11 | 50 ± 15 | 29 ± 11 | 13.1 ± 2.7 | 11.1 ± 1.3 | 14.6 ± 2.0 |
| –10 | 12 ± 8 | 63 ± 10 | 25 ± 10 | 12.3 ± 4.0 | 13.2 ± 1.4 | 14.7 ± 2.1 |
| 0 | 28 ± 9 | 66 ± 11 | 6 ± 4 | 10.7 ± 1.6 | 13.6 ± 1.2 | 12.6 ± 1.7 |
| 10 | 68 ± 6 | 18 ± 5 | 14 ± 6 | 9.6 ± 0.9 | 11.1 ± 1.1 | 16.5 ± 2.0 |
| 20 | 66 ± 9 | 26 ± 7 | 8 ± 3 | 8.3 ± 0.5 | 13.0 ± 1.7 | 13.8 ± 2.2 |
| 40 | 78 ± 7 | 8 ± 4 | 14 ± 4 | 8.1 ± 0.4 | 13.5 ± 3.0 | 17.7 ± 3.3 |
| 60 | 56 ± 10 | 36 ± 12 | 8 ± 5 | 9.6 ± 0.9 | 11.3 ± 1.3 | 18.3 ± 5.5 |
| Forest reference | 64 ± 6 | 25 ± 6 | 11 ± 3 | 8.7 ± 0.4 | 10.0 ± 0.7 | 15.1 ± 2.1 |
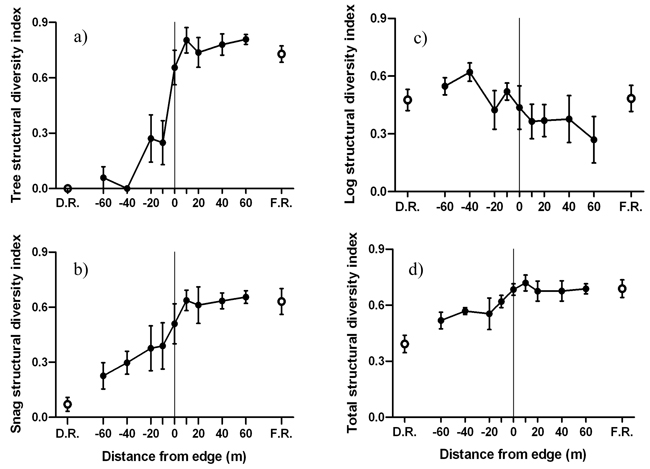
Fig. 6. Mean (± 1 SE) structural diversity index for a) live trees, b) snags, b) logs and d) all structural components combined along the insect disturbed area-forest edge. Open circles represent values for disturbed area reference (D.R.) and forest reference (F.R.). Sample size was n = 6 transects.
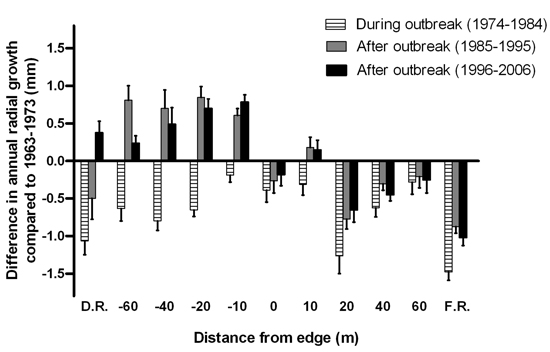
Fig. 7. Mean difference in annual radial growth (+ 1 SE) of Abies balsamea between the eleven-year interval prior to the start of the spruce budworm outbreak (1963–1973) and the eleven-year intervals during the outbreak in 1974–1984, after the outbreak in 1985–1995 and in 1996–2006. Sample sizes were n = 1, 1, 3, 5, 6, 5, 4, 5, 3, 1 and 8 live tree stems for distances D.R, –60, –40, –20, –10, 0, 10, 20, 40, 60 and F.R., respectively.