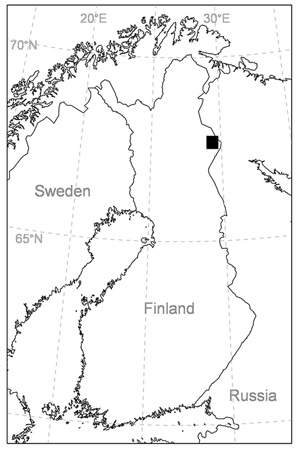
Fig. 1. Study area location in the Värriö strict nature reserve in northern Finland.
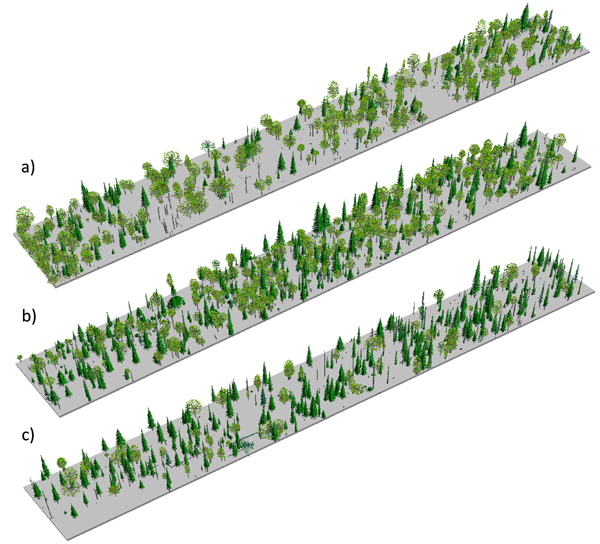
Fig. 2. Stand visualizations for the mid-successional (a), late-successional (b), and old-growth (c) stands.
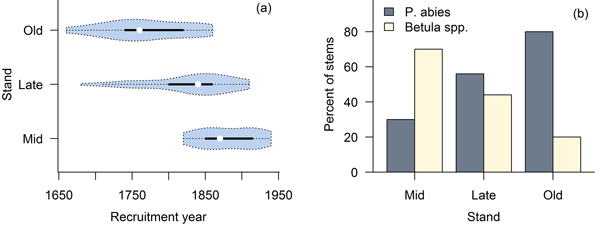
Fig. 3. Violin plots (Hintze and Nelson 1998) combining a boxplot and density trace of age distributions (a), and species compositions in the three stands (b).
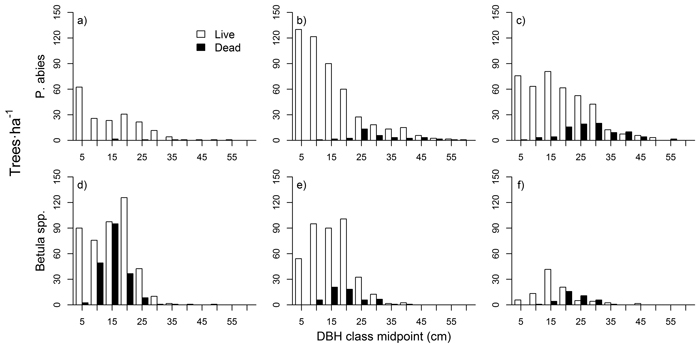
Fig. 4. Tree diameter distributions for P. abies in mid-successional (a), late-successional (b), and old-growth (c) stands, and for Betula spp. in mid-successional (d), late-successional (e), and old-growth stands (f).
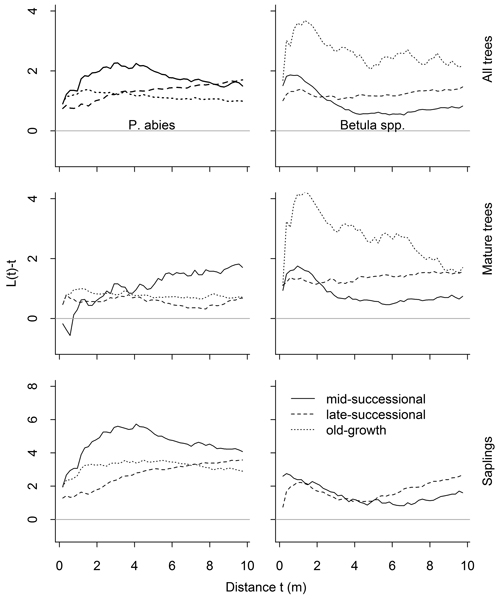
Fig. 5. Results of the univariate spatial point pattern analyses L(t), for all trees, mature trees and saplings, and separately for both species. The expected value under complete spatial randomness is zero. Positive deviations indicate clustering, negative regularity. Significant deviations are shown in Table 1. There were only 13 Betula spp. saplings in the old-growth forests so we dropped them from the analyses.
| Table 1. Results of the point pattern analyses. Values in parentheses represent distances at which departures from the observed pattern deviated significantly from the random (univariate analyses) or independent (bivariate analyses). Alternatives were clumping (cl) for univariate analyses, and attraction (at) or repulsion (re) for bivariate analyses. There were only 13 Betula spp. saplings in the old-growth stand, which were thus dropped from the analyses (NA). | ||||
| Analysis | Groups | Mid-successional | Late-successional | Old-growth |
| Univariate | ||||
| All P. abies | cl (1–10) | cl (0–10) | cl (0–10) | |
| All Betula spp. | cl (0–3.5; 9–10) | cl (0–10) | cl (0.5–2.5) | |
| Mature P. abies | - | - | cl (1–4.5) | |
| Mature Betula spp. | cl (0–2.5) | cl (0–10) | - | |
| P. abies saplings | cl (1–10) | cl (1–10) | cl (1–10) | |
| Betula spp. saplings | - | cl (0.5–2.5; 6.5–10) | NA | |
| Intraspecific | ||||
| P. abies mature saplings | - | at (1–10) | at (0–10) | |
| Betula spp. mature saplings | at (0–3.5) | at (0–10) | NA | |
| Interspecific | ||||
| All P. abies – all Betula spp. | at (7–10) | - | - | |
| Mature P. abies – mature Betula spp. | - | re (3–8) | re (2–2.5) | |
| Mature P. abies – Betula spp. saplings | re (1–2) | - | NA | |
| P. abies saplings – mature Betula spp. | - | - | - | |
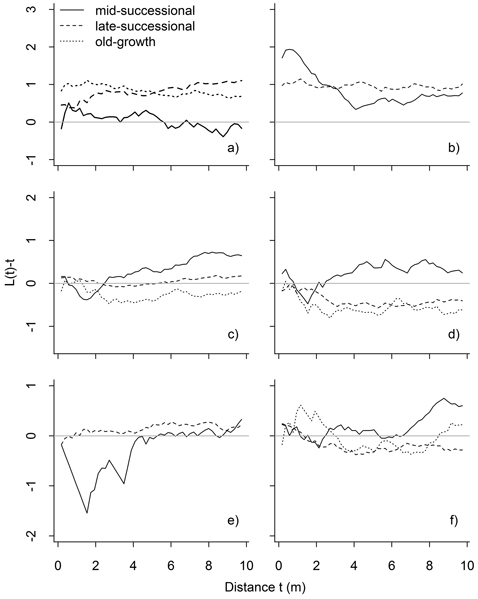
Fig. 6. Results of bivariate point pattern analyses, in which the expected value under population independence is zero. Values above zero indicate attraction, and below zero repulsion: mature P. abies vs. P. abies saplings (a), mature Betula spp. vs. Betula spp. saplings (b), all P. abies vs. all Betula spp. (c), mature P. abies vs. mature Betula spp. (d), mature P. abies vs. Betula spp. saplings (e), and mature Betula spp. vs. P. abies saplings (f). Significant deviations are shown in Table 1.