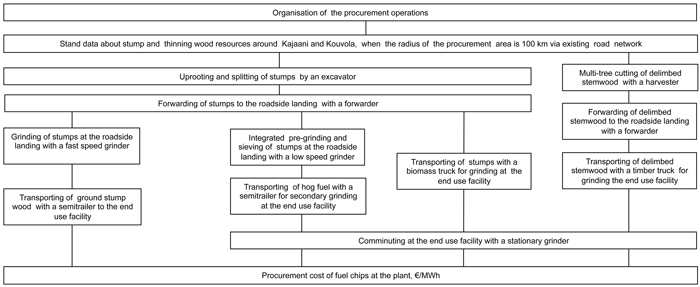
Fig. 1. The supply chains of this study by the main work stages. View larger in new window/tab.
| Table 1. The productivity parameters for the supply chains (Fig. 1). | ||||
| Delimbed stems | Pre-ground stumps | Ground stumps | Split stumps | |
| Gross effective time (E15h) coefficient for cutting/uprooting | 1.3 | 1.4 | 1.4 | 1.4 |
| Payload of the forwarder, m³ | 9.0 | 8.6 | 8.6 | 8.6 |
| Gross effective time (E15h) coefficient for forwarding | 1.3 | 1.2 | 1.2 | 1.2 |
| Payload in transport by road, m³ | 67 | 25 | 27 | 32 |
| Loading time in transport by road, minutes | 50 | 44 | 54 | 62 |
| Unloading time in transport by road, minutes | 37 | 27 | 27 | 56 |
| Cost of grinding and pre-grinding at the roadside landing, € m–3 | - | 5.4 | 7.1 | - |
| Grinding productivity at the end use facility with the stationary grinder, loose-m3 E15h–1 | 180 | 270 | - | 180 |
| Cost of grinding at the end use facility with the stationary grinder, € m–3 | 2.8 | 1.9 | - | 2.8 |
| Table 2. Hourly cost details of the harvesting machines and grinders. | ||||||
| Harvester | Forwarder | Excavator | Low-speed grinder | Fast-speed grinder | Stationary grinder | |
| Purchase price, € | 478 000 | 260 000 | 160 000 | 703 000 | 730 000 | 2 200 000 |
| Salvage value, € | 135 190 | 45 001 | 65 000 | 190 766 | 198 093 | 134 460 |
| Lifespan, years | 4.7 | 7.2 | 6 | 7 | 7 | 15 |
| FIXED COSTS: | ||||||
| Depreciation, € a –1 | 69 146 | 27821 | 15 833 | 73 176 | 75 987 | 137 703 |
| Interest, € a –1 | 12 664 | 6400 | 6400 | 19 339 | 20 082 | 49 443 |
| Insurance, € a –1 | 1985 | 1400 | 500 | 9430 | 9430 | 9430 |
| Administration, € a –1 | 11 691 | 3700 | 3700 | 7500 | 7500 | 7500 |
| LABOR COSTS: | ||||||
| Annual gross effective working time, h | 3213 | 2087 | 1200 | 2200 | 1700 | 3800 |
| Annual working time, h | 3780 | 2318 | 1760 | 3115 | 2615 | 3800 |
| Degree of machine utilization, % | 85 | 90 | 68 | 71 | 65 | 100 |
| Average wage for a worker, € h–1 | 16.9 | 15.0 | 13.3 | 17 | 17 | 5.61 |
| Indirect wage costs, % | 112 | 131 | 83 | 68 | 68 | 68 |
| Wage costs total, € a–1 | 135 941 | 80 393 | 42 801 | 88 964 | 74 684 | 35 814 |
| OPERATING COSTS: | ||||||
| Fuel price, € l –1 | 0.87 | 0.87 | 0.87 | 0.87 | 0.87 | 0.54 |
| Fuel cost, € a–1 | 41 930 | 21 784 | 17 435 | 133 521 | 108 302 | 115 443 |
| Oil and lubricant cost, € a –1 | 4935 | 1219 | 3796 | 5547 | 3772 | 16 863 |
| Service and maintenance cost, € a –1 | 24 428 | 9944 | 1380 | 50 610 | 46 410 | 135 660 |
| Translocation costs, € a –1 | 16 325 | 11 499 | 1000 | - | - | - |
| Risk and profit margin, € a –1 | 9571 | 4925 | 2803 | 19 404 | 17 308 | 25 393 |
| TOTAL COSTS: | 328 616 | 169 084 | 96 248 | 407 492 | 363 475 | 533 249 |
| Operating hour cost, € E15–1 (Value-added tax 0%) | 102.3 | 81.0 | 80.2 | 185.2 | 213.8 | 140.3 |
| Table 3. Hourly cost details of the truck-trailer units. | |||
| Timber truck | Biomass truck | Semitrailer unit | |
| Purchase price of tractor, € | 204 000 | 182 000 | 105 000 |
| Salvage value, € | 55 000 | 55 000 | 30 000 |
| Lifespan, years & kilometers | 4 & 480 000 | 4 & 480 000 | 8 & 720 000 |
| Purchase price of trailer, € | 70 000 | 90 000 | 80 000 |
| Salvage value, € | 5000 | 5000 | 10 000 |
| Lifespan, years & kilometers | 8 & 960 000 | 8 & 960 000 | 12 & 1 080 000 |
| Purchase price of timber crane, € | 71 500 | 71 500 | - |
| Salvage value, € | 5000 | 5000 | - |
| Lifespan, years | 4 | 4 | - |
| FIXED COSTS: | |||
| Depreciation, € a –1 | 58 850 | 56 225 | 13 832 |
| Interest, € a –1 | 13 820 | 13 740 | 7 400 |
| Insurance, € a –1 | 8600 | 8600 | 5500 |
| Administration, € a –1 | 8678 | 8626 | 7406 |
| LABOR COSTS: | |||
| Annual gross effective working time, h | 5400 | 6000 | 3938 |
| Annual working time, h | 5670 | 6300 | 4056 |
| Degree of machine utilization , % | 95 | 95 | 97 |
| Average wage for a worker, € h–1 | 17 | 17 | 17 |
| Indirect wage costs, % | 68 | 68 | 68 |
| Daily allowance, € a–1 | 6000 | 6000 | 3380 |
| Wage costs total, € a–1 | 167 935 | 185 928 | 119 209 |
| OPERATING COSTS: | |||
| Fuel price, € l –1 | 1.16 | 1.16 | 1.16 |
| Fuel cost, € a–1 | 87 000 | 80 736 | 46 980 |
| Tire cost, € a –1 | 11 786 | 10 821 | 6988 |
| Service and maintenance cost, € a –1 | 19 000 | 21 000 | 14 000 |
| Risk and profit margin (3%), € a –1 | 11 619 | 11 928 | 6845 |
| TOTAL COSTS: | 387 260 | 397 600 | 228 160 |
| Operating hour cost, € E15–1 (Value-added tax 0%) | 72 | 66 | 58 |
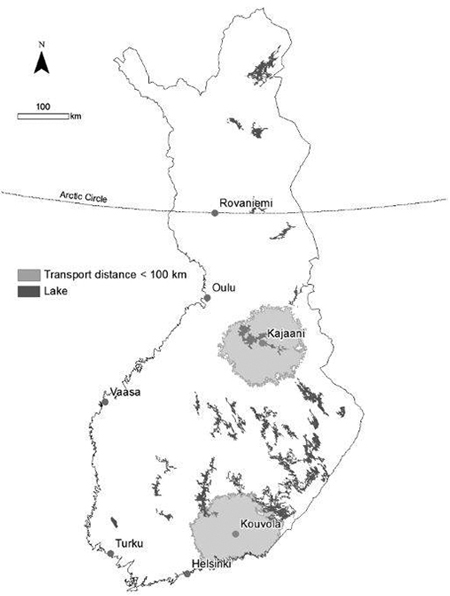
Fig. 2. The procurement areas around Kajaani and Kouvola, where the radius is 100 km via the existing road network.
| Table 4. The basic stand data estimates for delimbed stems and stumps around Kajaani and Kouvola. The abbreviation SD = standard deviation. | ||
| Kajaani | Kouvola | |
| Average volume of stems harvested, dm3 | 24 (SD 11) | 28 (SD 12) |
| Average removal, number of stems per hectare | 1907 (SD 344) | 1721 (SD 244) |
| Average removal, m3 of stems harvested per hectare | 43 (SD 16) | 48 (SD 20) |
| Average volume of stumps harvested, dm3 | 87 (SD 32) | 140 (SD 40) |
| Average diameter of stumps harvested, cm | 27 (SD 4) | 34 (SD 4) |
| Average removal, number of stumps per hectare | 599 (SD 319 ) | 444 (SD 203) |
| Average removal, m3 of stumps harvested per hectare | 48 (SD 21) | 62 (SD 26) |
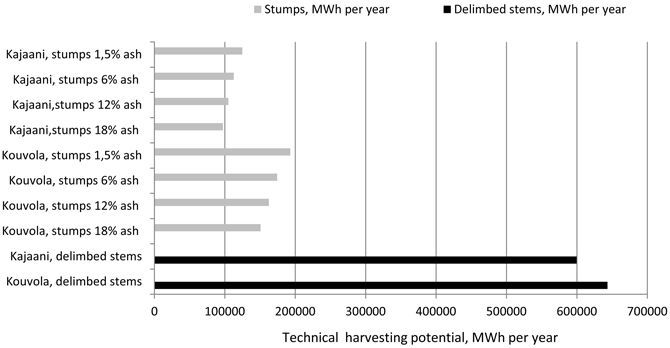
Fig. 3. The technical harvesting potential of delimbed stems and stumps for fuel (MWh per year) around the cities of Kajaani and Kouvola, when using alternative contaminant contents for ground stumps.
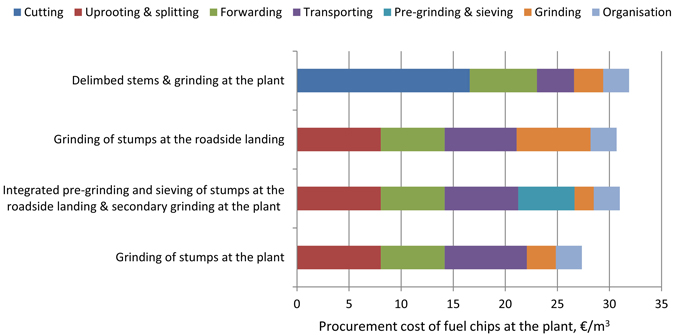
Fig. 4. The procurement cost structure of the supply chains and raw materials of this study. The off-road transportation distance is 219 m, and the on-road transportation distance is 50 km.
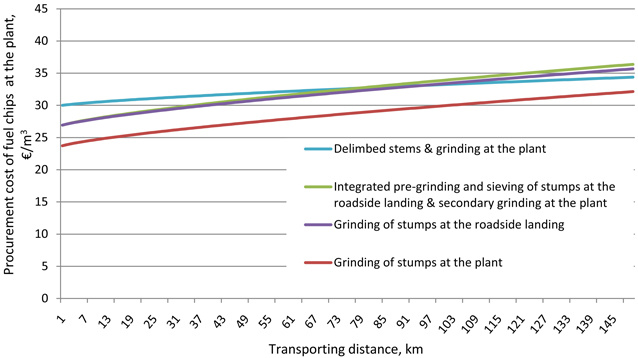
Fig. 5. The procurement cost comparison of the supply chains and raw materials as a function of on-road transportation distance.
| Table 5. Productivity and cost values for cutting, uprooting, and forwarding in the procurement areas of Kajaani and Kouvola. The abbreviation SD = standard deviation. | ||
| Kajaani | Kouvola | |
| Average cutting productivity for harvested delimbed stems, m3 E15h–1 | 5.1 (SD 1.0) | 5.1 (SD 1.3) |
| Average cutting cost for harvested delimbed stems, € m–3 | 20.8 (SD 3.9) | 21.0 (SD 4.8) |
| Average forwarding productivity for harvested delimbed stems, m3 E15h–1 | 11.9 (SD 0.9) | 12.3 (SD 0.9) |
| Average forwarding cost for harvested delimbed stems, € m–3 | 6.9 (SD 0.5) | 6.6 (SD 0.5) |
| Average uprooting productivity for harvested stumps, m3 E15h–1 | 7.6 (SD 1.5) | 9.2 (SD 0.9) |
| Average uprooting cost for harvested stumps, € m–3 | 10.8 (SD 2.6) | 8.6 (SD 1.1) |
| Average forwarding productivity for harvested stumps, m3 E15h–1 | 12.7 (SD 2.2) | 12.9 (SD 2.3) |
| Average forwarding cost for harvested stumps, € m–3 | 6.6 (SD 2.2) | 6.5 (SD 1.4) |
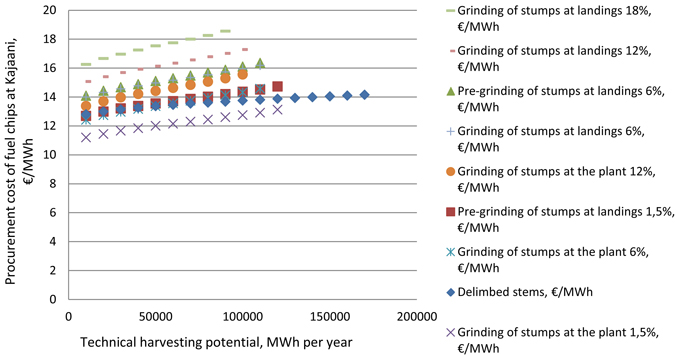
Fig. 6. The procurement cost of fuel chips around Kajaani when using alternative supply chains and alternative contaminant contents for ground stumps, as a function of harvesting potential.
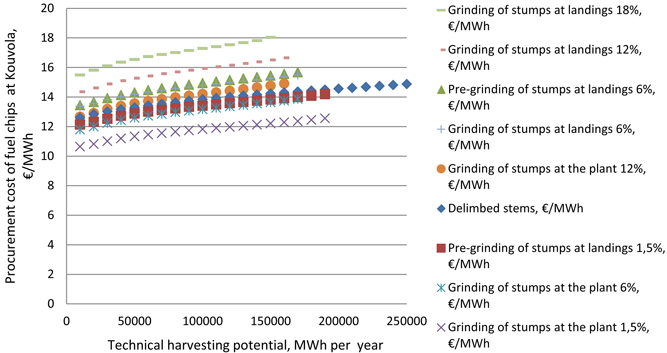
Fig. 7. The procurement cost of fuel chips around Kouvola when using alternative supply chains and alternative contaminant contents for ground stumps, as a function of harvesting potential.
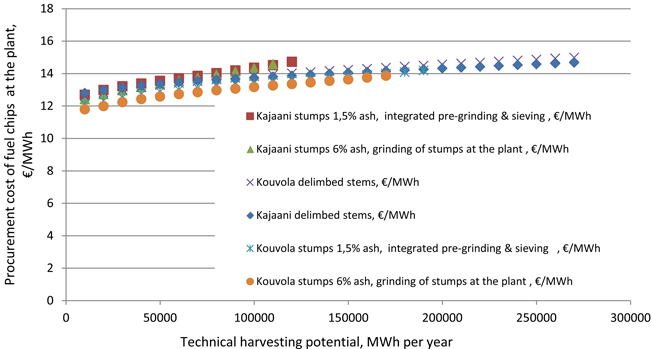
Fig. 8. The procurement costs of ground stumps and delimbed stems chips in Kajaani and Kouvola, as a function of harvesting potential.