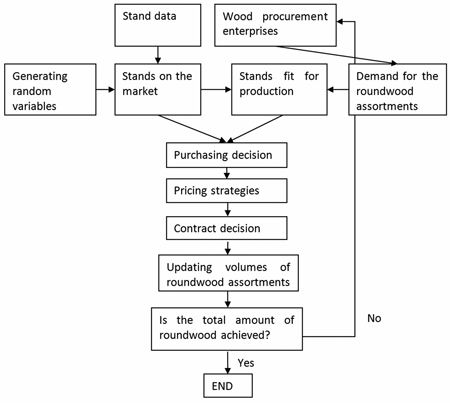
Fig. 1. The main parts of the roundwood procurement model.
| Table 1. The main characteristics of the Scots pine timber stands in the simulation model. Dgm is the basal area median diameter at breast height and Hgm is the height of the respective tree. | ||||
| Variable | Random | Min | Max | Average |
| x and y coordinates of the stand (m) | Yes | 0 | 150 000 | |
| Area (ha) | Yes | 0.5 | 5 | |
| Volume (m3/ha) | No | 86.1 | 355.5 | 181.2 |
| Dgm (cm) | No | 23.4 | 33.3 | 28.4 |
| Hgm (m) | No | 17.0 | 29.0 | 23.3 |
| Share of grade A butt logs (%) | No | 1.6 | 39.4 | 25.8 |
| Share of conventional saw los (%) | No | 26.9 | 62.5 | 47.3 |
| Share of small-diameter saw logs (%) | No | 0.9 | 12.9 | 4.8 |
| Share of pulpwood (%) | No | 6.6 | 48.5 | 20.6 |
| Table 2. Roundwood procurement objectives (m3) of the roundwood buyers. | |||||
| Corporation, buyer A | Corporation, buyer B | Sawmill, buyer C | Sawmill, buyer D | Total | |
| Grade A butt logs | 198 000 | 153 600 | 40 800 | 129 200 | 521 600 |
| Conventional saw logs | 423 000 | 275 200 | 70 200 | 193 800 | 964 000 |
| Small-diameter logs | 45 000 | 25 600 | 7200 | 17 000 | 94 800 |
| Pulpwood | 234 000 | 185 600 | 419 600 | ||
| Total | 900 000 | 640 000 | 120 000 | 340 000 | 2 000 000 |
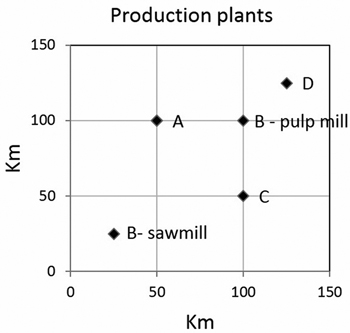
Fig. 2. The locations of the production plants. Corporation A has both a sawmill and a pulp mill at the same address, Corporation B has sawmill (B-sawmill) and pulp production unit (B-pulp plant) in different locations, and Sawmills C and D both have only one sawmill.
| Table 3. Pricing scenarios (S1-S16) in the study. The default pricing system is based on unit prices of roundwood assortment (UV), the pricing based on residual value appraisal (RVA) is marked with an “X”. | ||||||||||||||||
| S1 | S2 | S3 | S4 | S5 | S6 | S7 | S8 | S9 | S10 | S11 | S12 | S13 | S14 | S15 | S16 | |
| Buyer A | X | X | X | X | X | X | X | X | ||||||||
| Buyer B | X | X | X | X | X | X | X | X | ||||||||
| Buyer C | X | X | X | X | X | X | X | X | ||||||||
| Buyer D | X | X | X | X | X | X | X | X | ||||||||
| Table 4. Average residual values (€/m3) at the production and wood paying capabilities (WPC) (€/m3) at the stump, and the maximum, average and minimum unit stumpage values (USV) (€/m3) for the roundwood assortments in the validation simulations. | ||||
| Grade A butt logs | Saw logs | Small-diameter saw logs | Pulpwood | |
| Average residual value at production | 112.78 | 81.62 | 38.62 | 40.00 |
| Average WPC at the stump | 97.34 | 66.10 | 23.11 | 18.46 |
| Max USV | 71.94 | 59.79 | 24.71 | 19.64 |
| Average USV | 66.74 | 54.32 | 20.12 | 15.17 |
| Min USV | 44.61 | 33.45 | 6.04 | 6.60 |
| Table 5. Wood paying capability (WPC) and unit stumpage value (USV) as euros per cubic metre in the basic pricing scenario (S1), where each roundwood buyer uses pricing based on unit prices (UP) of roundwood assortments. | |||||
| Grade A butt logs | Saw logs | Small-diameter saw logs | Pulpwood | All assortments | |
| WPC/USV | WPC/USV | WPC/USV | WPC/USV | WPC/USV | |
| Buyer A | 99.97 / 68.50 | 67.45 / 56.01 | 24.48 / 21.23 | 19.55 / 16.32 | 63.43 / 49.03 |
| Buyer B | 100.04 / 68.08 | 67.33 / 55.63 | 24.32 / 21.04 | 16.59 / 13.30 | 53.81 / 41.29 |
| Buyer C | 99.70 / 63.65 | 67.58 / 52.12 | 25.2 / 20.08 | 75.12 / 53.55 | |
| Buyer D | 100.50 / 67.26 | 67.79 / 54.88 | 25.02 / 21.03 | 76.48 / 57.31 | |
| Table 6. The change in wood paying capability (WPC) and unit stumpage value (USV) in euros per cubic metre compared to basic scenario S1 (Table 5) for scenarios S2-S5 where each buyer in turn uses residual value appraisal (RVA)-based pricing and other buyers use pricing based on the unit prices (UP) of roundwood assortments. | |||||
| Grade A butt logs | Saw logs | Small-diameter saw logs | Pulpwood | All assortments | |
| WPC/USV | WPC/USV | WPC/USV | WPC/USV | WPC/USV | |
| Buyer A uses RVA, other buyers use UP: | |||||
| Buyer A | 1.31 / 1.77 | 0.53 / 0.48 | -0.16 / 0.16 | -0.58 / -0.54 | 1.00 / 0.86 |
| Buyer B | -1.63 / 0.29 | -0.82 / 0.23 | -0.06 / -0.01 | 0.05 / 0.06 | -1.27 / -0.21 |
| Buyer C | -1.32 / 0.45 | -0.72 / 0.34 | 0.02 / 0.13 | -1.21 / 0.17 | |
| Buyer D | -1.45 / 0.33 | -0.82 / 0.23 | -0.07 / -0.03 | -1.70 / -0.17 | |
| Buyer B uses RVA, other buyers use UP: | |||||
| Buyer A | -1.01 / 0.06 | -0.54 / 0.03 | -0.06 / -0.11 | -0.03 / -0.02 | -0.91 / -0.20 |
| Buyer B | 1.34 / 2.01 | 0.62 / 0.61 | -0.20 / 0.10 | 0.15 / 0.11 | 1.90 / 1.60 |
| Buyer C | -1.72 / 0.44 | -0.91 / 0.30 | -0.09 / 0.04 | -1.61 / 0.07 | |
| Buyer D | -0.12 / 0.25 | -0.05 / 0.21 | 0.07 / 0.05 | -0.18 / 0.17 | |
| Buyer C uses RVA, other buyers use UP: | |||||
| Buyer A | -0.18 / 0.00 | -0.13 / 0.00 | 0.03 / -0.04 | 0.02 / 0.02 | -0.14 / -0.03 |
| Buyer B | -0.77 / -0.11 | -0.47 / -0.12 | -0.31 / -0.29 | 0.01 / 0.08 | -0.69 / -0.29 |
| Buyer C | 3.34 / 2.00 | 1.92 / 0.92 | -0.38 / 0.02 | 3.66 / 1.98 | |
| Buyer D | -0.50 / -0.14 | -0.35 / -0.15 | -0.17 / -0.22 | -0.53 / -0.25 | |
| Buyer D uses RVA, other buyers use UP: | |||||
| Buyer A | -0.74 / -0.02 | -0.39 / -0.04 | -0.07 / -0.12 | 0.00 / 0.00 | -0.69 / -0.22 |
| Buyer B | -0.17 / 0.10 | -0.06 / 0.08 | -0.02 / -0.01 | 0.06 / 0.08 | -0.63 / -0.34 |
| Buyer C | -1.29 / 0.14 | -0.66 / 0.06 | -0.14 / -0.06 | -1.21 / -0.12 | |
| Buyer D | 1.34 / 1.67 | 0.63 / 0.34 | -0.17 / 0.20 | 1.76 / 1.27 | |
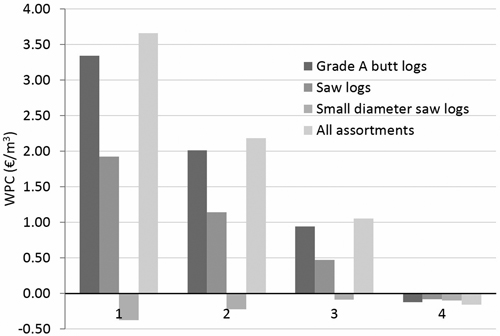
Fig. 3. The effect of competition on the WPC (€/m3) of roundwood buyer C when it is the only user of residual value appraisal (RVA)-based pricing (1), one other buyer is also using RVA (2), two other buyers are using RVA (3) or all buyers are using RVA (4).
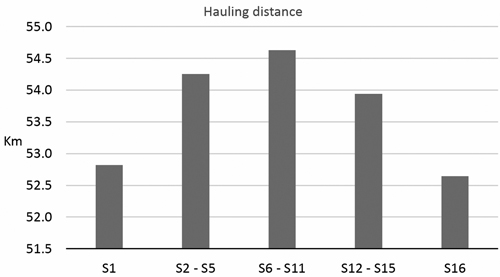
Fig. 4. The effect of competition on hauling distance, when all buyers use UP (S1), only one buyer uses residual value appraisal (RVA) (S2 – S5), two buyers use RVA (S6 – S11), three buyers use RVA (S12 – S15) or all buyers use RVA.