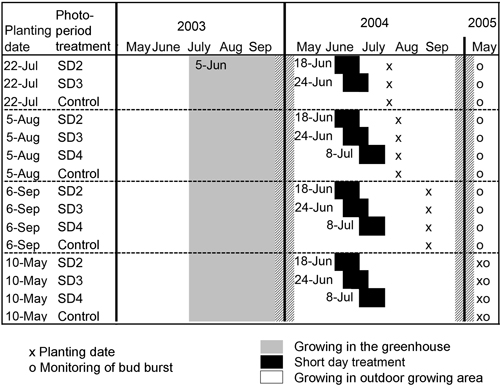
Fig. 1. Treatments, growing and planting schedule for Norway spruce container seedlings grown and planted in Suonenjoki in 2003–2005.
| Table 1. Weather data for the Suonenjoki Research Unit (Finnish Forest Research Institute) in 2004–2006 and long-term average (1974–2006). T indicates temperature. | ||||
| 2004 | 2005 | 2006 | 1974–2006 | |
| Mean temperature (2 m), °C | ||||
| May | 8.9 | 8.7 | 9.9 | 9.0 |
| June | 10.6 | 14.0 | 15.5 | 14.2 |
| July | 14.8 | 18.2 | 17.4 | 16.6 |
| August | 16.2 | 15.3 | 17.5 | 14.3 |
| September | 12.4 | 10.5 | 11.3 | 9.3 |
| Monthly precipitation, mm | ||||
| May | 58 | 97 | 43 | 40 |
| June | 102 | 80 | 35 | 68 |
| July | 58 | 138 | 35 | 82 |
| August | 147 | 55 | 38 | 80 |
| September | 59 | 34 | 66 | 57 |
| The latest day when T < 0 °C at 10 cm in spring | ||||
| Temperature | –2.4 | –0.1 | –0.8 | |
| Date | 8 June | 2 June | 30 May | |
| The latest day when T < –3 °C at 10 cm in spring | ||||
| Temperature | –7.0 | –3.5 | –7.0 | |
| Date | 14 May | 2 May | 18 May | |
| Table 2. Percentage of seedlings showing a second flush after short day (SD) treatment in same summer; the date when 50% of seedlings were flushing the spring after the SD treatments; the percentage of seedlings with unburst buds in the spring after the SD treatments; and the percentage of seedlings with multiple leaders at the end of third growing season. Seedlings were SD-treated on three different occasions in 2004 and then planted on three dates in summer 2004 and on a single occasion in spring 2005. Control seedlings were grown under natural photoperiod conditions. P-values given by a generalized linear mixed model or linear mixed model analysis are presented after each variable. Different letters indicate a statistically significant difference (p < 0.05) among photoperiod treatments for dates when 50% of seedlings were flushing within the planting dates. A superscript 1 indicates statistically significant difference to spring planting within the photoperiod treatment. | |||||
| Planting date | Photoperiod treatment | Second flush | Bud burst | Unburst buds | Multiple leaders |
| 22-Jul | SD2 | 3 | 22-May a1 | 10 | 33 |
| SD3 | 0 | 18-May b1 | 10 | 23 | |
| Control | 0 | 22-May a1 | 15 | 18 | |
| 5-Aug | SD2 | 5 | 22-May a1 | 5 | 30 |
| SD3 | 0 | 22-May a1 | 0 | 33 | |
| SD4 | 0 | 21-May a1 | 15 | 21 | |
| Control | 0 | 23-May a1 | 10 | 40 | |
| 6-Sep | SD2 | 3 | 23-May a | 15 | 10 |
| SD3 | 0 | 26-May a | 5 | 15 | |
| SD4 | 0 | 24-May a | 5 | 15 | |
| Control | 0 | 2-Jun b | 5 | 3 | |
| 10-May | SD2 | 19-May a | 10 | 8 | |
| SD3 | 25-May a | 5 | 3 | ||
| SD4 | 24-May a | 10 | 8 | ||
| Control | 1-Jun b | 15 | 5 | ||
| p-values | Planting date (P) | 0.986 | <0.001 | 0.860 | <0.001 |
| Photoperiod treatment (S) | 0.808 | <0.001 | 0.997 | 0.565 | |
| P × S | 1.000 | 0.004 | 0.906 | 0.304 | |
| Table 3. Repeated (measuring year, Y) mixed model analysis of variance for planting date (P) and photoperiod treatment (S) on height of Norway spruce seedlings. | ||
| F | p | |
| Date (P) | 80 | <0.001 |
| Treatment (S) | 16 | <0.001 |
| Year (Y) | 4644 | <0.001 |
| P × S | 2 | 0.140 |
| P × Y | 259 | <0.001 |
| S × Y | 15 | <0.001 |
| P × S × Y | 2 | 0.001 |
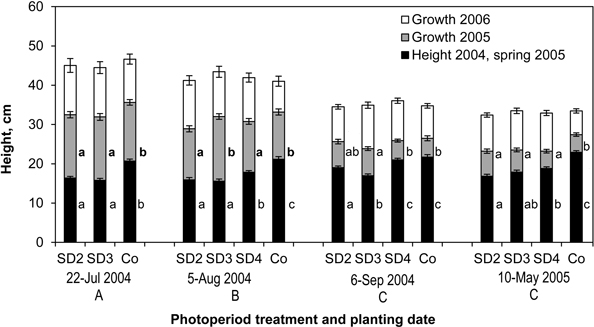
Fig. 2. Height of seedlings at the end of growing seasons 2004 (height at planting for seedlings planted in the spring 2005), 2005 and 2006. Seeds were sown on 5 June 2003 and seedlings were short day- (SD) treated on three different occasions in 2004 and then planted on three dates in summer 2004 and on a single occasion in spring 2005 (N = 10 seedlings in 4 blocks). Untreated control (Co) seedlings were grown under natural photoperiod conditions. Vertical bars indicate the standard errors (SE) of mean height at the end of each season and different letters below the plating dates show statistically significant differences (p < 0.05) among planting dates and letters next to bars show differences among treatments within a planting date and a measurement year.