| Table 1. Mean, minimum and maximum values of initial stand characteristics calculated from the 38 sample plots. | |||
| Number of stems ha–1 | Diametera) (cm) | Heighta) (m) | |
| Pine | 2980 (130–12860) | 4.5 (1.2–8.2) | 3.8 (1.9–5.7) |
| Spruce | 2390 (380–5220) | 4.6 (2.4–7.5) | 4.4 (3–6.5) |
| Birch | 1540 (0–5860) | 5.8 (0.9–11.4) | 5.7 (2.1–7.7) |
| Total | 6910 (2550–14390) | 5.5 (3.5–8.1) | 4.9 (3.1–6.6) |
| a) Basal area weighted mean Σ(x*d2)/Σd2 | |||
| Table 2. Relative distribution of sample plots with different vegetation types, soil moisture classes and site index (H100) for pine and spruce according to site factors (Hägglund and Lundmark 1981). | ||
| Frequency (%) | ||
| Vegetation type class | ||
| Narrow leaved grassesa) | 55 | |
| Vaccinium myrtillus | 5 | |
| Vaccinium vitis-idea | 16 | |
| Calluna vulgaris | 18 | |
| Moist mossesb) | 5 | |
| Soil moisture type | ||
| Dry | 13 | |
| Mesic | 79 | |
| Moist | 8 | |
| Site index | Pine | Spruce |
| –22 (m) | 24 | 0 |
| 22–24 | 18 | 0 |
| 24–26 | 58 | 16 |
| 26–28 | 0 | 26 |
| 28–30 | 0 | 58 |
| a) Mainly Deschampsia flexuosa b) Mosses indicating moist and wet conditions (e.g. Polytrichum spp.) | ||
| Table 3. Average thinning grade and thinning quotient (TQ) for the three simulated thinnings. Thinning grade refers to the proportion of basal area removed at thinning. Thinning quotient refers to the quotient between the mean diameter of removed stems and the mean diameter of the stand before thinning. TRAD = traditional; HQ = high quality; HETERO = stem-wise mixture; MOSAIC = mosaic-wise mixture. | |||||||||
| Treatment | Removal (%) | TQ | |||||||
| Total | Pine | Spruce | Birch | Total | Pine | Spruce | Birch | ||
| TRAD | 27 | 25 | 25 | 60 | 0.95 | 0.94 | 0.93 | 0.94 | |
| KVAL | 27 | 26 | 25 | 54 | 0.95 | 0.94 | 0.93 | 0.95 | |
| HETERO | 27 | 28 | 30 | 21 | 0.94 | 0.95 | 0.93 | 0.95 | |
| MOSAIK | 25 | 25 | 25 | 26 | 0.93 | 0.94 | 0.92 | 0.93 | |
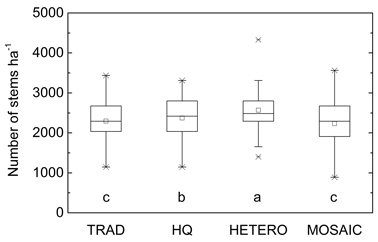
Fig. 1. Average stem number after precommercial thinning according to the different strategies on the 38 plots. Significant differences are marked with letters. TRAD = traditional; HQ = high quality; HETERO = stem-wise mixture; MOSAIC = mosaic-wise mixture.
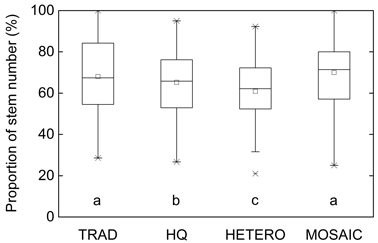
Fig. 2. The share (%) of remaining trees after the different precommercial thinning strategies, which were also selected to be retained according to all the other treatments on the 38 plots. Significant differences are marked with letters. TRAD = traditional; HQ = high quality; HETERO = stem-wise mixture; MOSAIC = mosaic-wise mixture.
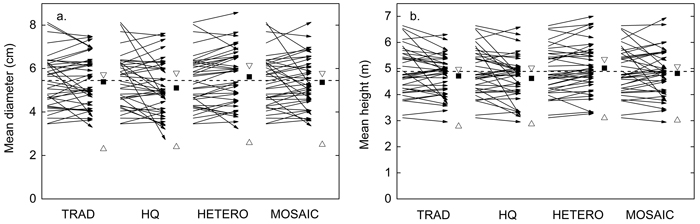
Fig. 3. Influence of precommercial thinning (PCT) on average basal area weighted a) diameter and b) tree height. Arrows; plot wise average before PCT (start) and after each treatment (end). Vertical dashed line; stand-wise average before PCT. Filled squares; stand-wise average after PCT. Unfilled triangles; potential maximum and minimum average after selection solely by dimension, maintaining the same number of retained stems and tree species composition on each plot as in the simulated PCT. TRAD = traditional; HQ = high quality; HETERO = stem-wise mixture; MOSAIC = mosaic-wise mixture.
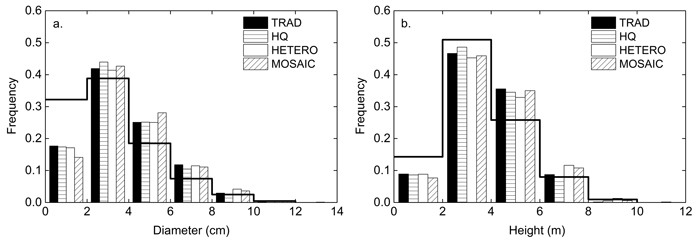
Fig. 4. Relative a) diameter and b) height distribution before (line) and after precommercial thinning according to TRAD = traditional, HQ = high quality, HETERO = stem-wise mixture and MOSAIC = mosaic-wise mixture.
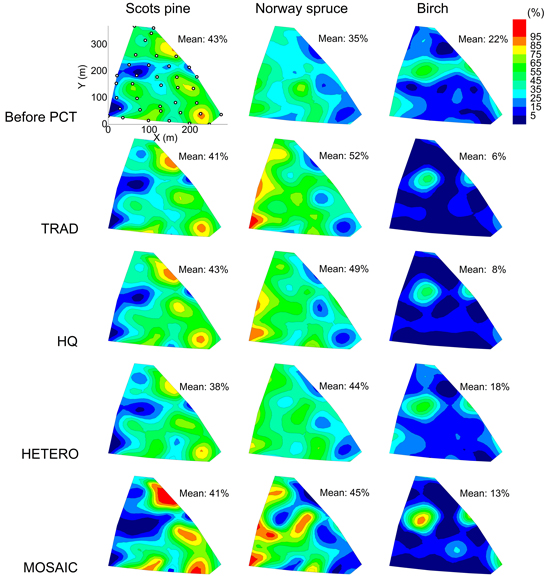
Fig. 5. Tree species distribution within the study area according to the proportion of stem number after precommercial thinning for different treatments. Average proportion at stand level is presented for each tree species and strategy. The positions of the 38 plots are shown in the top left diagram. TRAD = traditional; HQ = high quality; HETERO = stem-wise mixture; MOSAIC = mosaic-wise mixture.
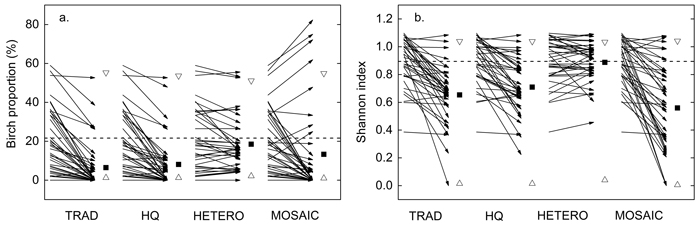
Fig. 6. Influence of precommercial thinning (PCT) on a) birch proportion and b) Shannon diversity index. Arrows; plot wise average before PCT (start) and after each treatment (end). Vertical dashed line; stand-wise average before PCT. Filled squares; stand-wise average after PCT. Unfilled triangles; theoretical maximum and minimum average after a) including and excluding as many birches on each plot as possible, b) distributing the retained stems as evenly among the species or on as few species as possible within each plot. The theoretical maximum and minimum were based on the same number of retained stems on each plot as in the simulated PCT. TRAD = traditional; HQ = high quality; HETERO = stem-wise mixture; MOSAIC = mosaic-wise mixture.
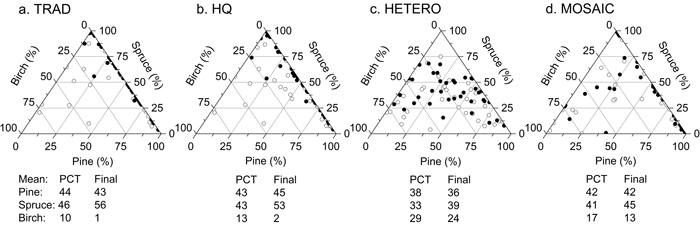
Fig. 7. Tree species distribution (%) according basal area after precommercial thinning (unfilled circles) and after simulating the stand development from the time of precommercial thinning until a stand age of 80 years (filled circles) on the 38 plots. Average proportion at stand level is presented for each tree species and strategy. TRAD = traditional; HQ = high quality; HETERO = stem-wise mixture; MOSAIC = mosaic-wise mixture.
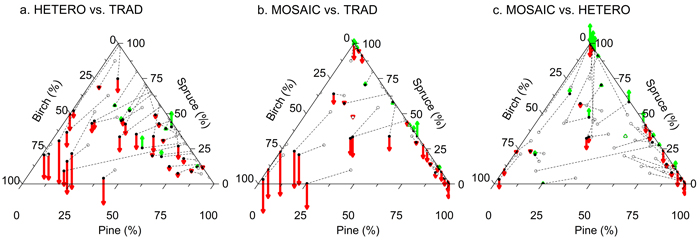
Fig. 8. Volume growth of a subject treatment relative to an alternative treatment during a rotation of 80 years. Tree species distribution according to basal area after PCT of the subject (filled circles) and alternative treatment (TRAD in a and b, HETERO in c) (unfilled circles) is presented for the 38 plots. Pairs belonging to the same plot are linked with dashed lines. The relative difference in MAI compared to the alternative treatment is marked with vectors starting from filled circles (green upwards arrow = gain, red downwards arrow = loss). TRAD = traditional; HETERO = stem-wise mixture; MOSAIC = mosaic-wise mixture. View larger in new window/tab.