| Table 1. General description of the twelve artificial gaps created in December 2004 at Qingyuan Forest CERN, CAS. | ||||||
| Canopy gap | Area (m2) | Mean height of canopy trees surrounding gaps (m) | Slope (o) | Aspect (o) | Elevation (m) | |
| L1 | 513.9 | 19 | 17 | 170 | 650 | |
| L2 | 621.1 | 17 | 23 | 150 | 670 | |
| M1 | 267.3 | 17 | 24 | 140 | 640 | |
| M2 | 174.1 | 16 | 20 | 155 | 690 | |
| M3 | 307.9 | 16 | 25 | 145 | 673 | |
| M4 | 321.2 | 17 | 25 | 160 | 681 | |
| S1 | 83.9 | 16 | 20 | 170 | 630 | |
| S2 | 75.5 | 17 | 22 | 140 | 640 | |
| S3 | 68.4 | 16 | 23 | 170 | 675 | |
| S4 | 86.4 | 18 | 20 | 150 | 634 | |
| S5 | 113.8 | 17 | 26 | 145 | 655 | |
| S6 | 124.5 | 16 | 24 | 165 | 669 | |
| L1 – L2 = large gaps M1 – M4 = middle gaps S1 – S6 = small gaps | ||||||
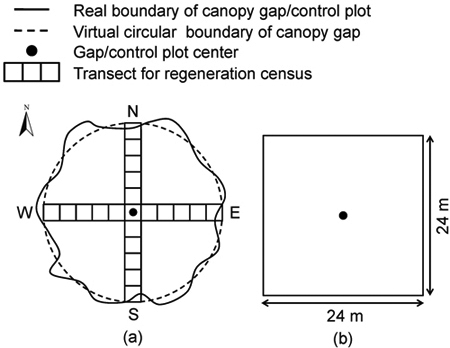
Fig. 1. The schematic of the experimental design: (a) canopy gap and (b) control plot.
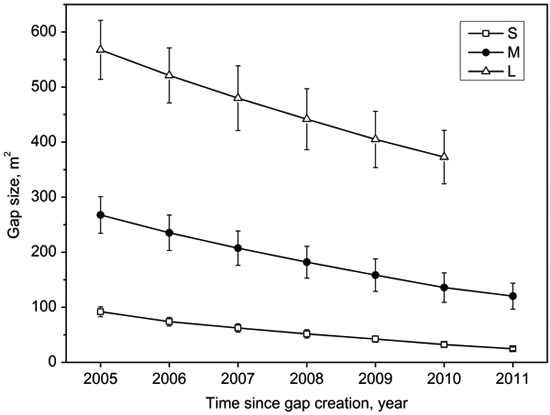
Fig. 2. Mean (with standard error) size of small gaps (S), middle gaps (M), and large gaps (L) as a function of time after gap creation in December 2004.
| Table 2. Gap closure equations of lateral extension growth for small gaps (S), middle gaps (M) and large gaps (L). | |
| Gap type | Canopy gap size (m2) |
| S | y = 0.7333x2 – 16.765x + 106.59 (n = 42) |
| M | y = 1.3584x2 – 35.521x + 301.61 (n = 28) |
| L | y = 1.5937x2 – 50.018x + 615.56 (n = 12) |
| x = gap age y = gap size n = number of hemispherical photographs | |
| Table 3. Mean (with standard error) closure rates and lateral extension growth rates of small gaps (S), middle gaps (M) and large gaps (L) for seven (six for large gaps) years. | |||
| Gap type | Closure rate (m2 a–1) | Percentage of closure rate (% a–1) | Lateral growth rate (cm a–1) |
| S | 11.2 ± 1.5 | 12.2 ± 1.6 | 44.4 ± 3.3 |
| M | 24.5 ± 2.3 | 9.2 ± 0.9 | 51.8 ± 3.6 |
| L | 38.9 ± 2.4 | 6.9 ± 0.4 | 52.0 ± 3.7 |
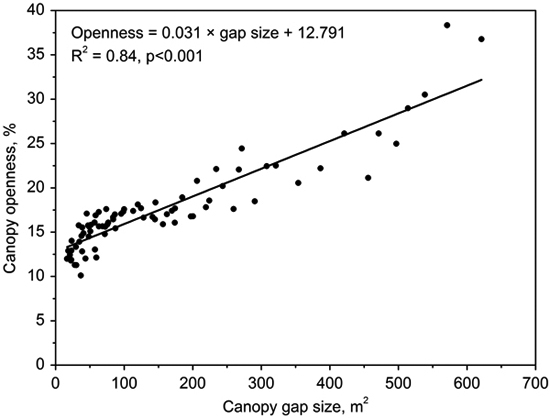
Fig. 3. Correlation between canopy openness and canopy gap size.
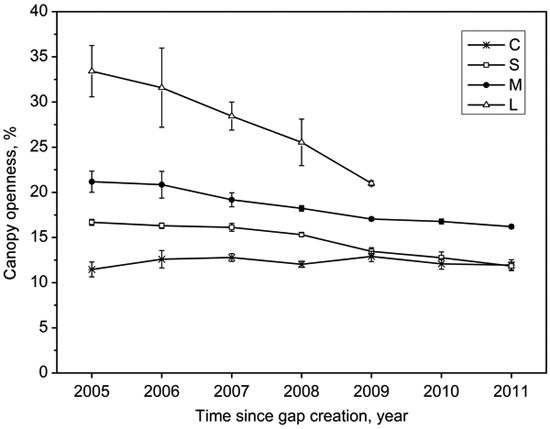
Fig. 4. Mean (with standard error) variation of canopy openness in the forest understory (C), small gaps (S), middle gaps (M), and large gaps (L) after gap creation in December 2004.
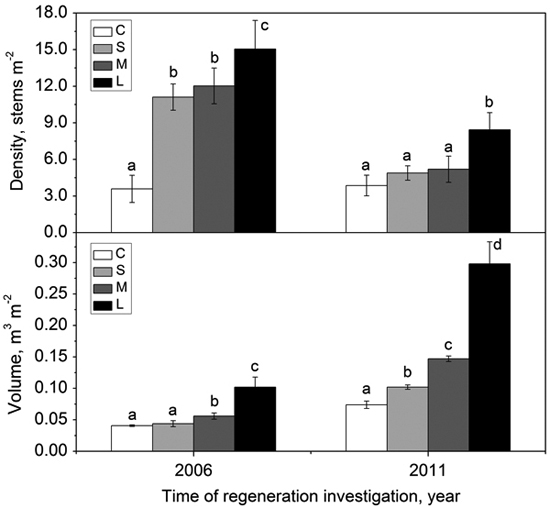
Fig. 5. Density (with standard error) and volume (with standard error) of woody species regeneration in the forest understory (C), small gaps (S), middle gaps (M), and large gaps (L) in 2006 and 2011 after gap creation (December 2004). Bars with different letters are significantly different (p < 0.05).
| Table 4. Density of regenerated woody species in the forest understory (C), small gaps (S), middle gaps (M), and large gaps (L) in 2006 and 2011. | |||||||||
| Species | Shade tolerance | Density (stems m–2) | |||||||
| 2006 | 2011 | ||||||||
| C | S | M | L | C | S | M | L | ||
| Betula costata Trautv. | shade-intolerant | 0.13 | 0.32 | 0.60 | 0.99 | 0.10 | 0.11 | 0.25 | 0.77 |
| Fraxinus mandshurica Rupr. | shade-intolerant | 0.32 | 0.99 | 1.09 | 1.46 | 0.46 | 0.46 | 0.47 | 1.02 |
| Fraxinus rhynchophylla | shade-intolerant | 0.77 | 1.96 | 2.48 | 3.66 | 0.58 | 0.73 | 0.75 | 1.58 |
| Juglans mandshurica Maxim. | shade-intolerant | 0.02 | 0.01 | 0.09 | 0.07 | 0.01 | 0.00 | 0.08 | 0.06 |
| Phellodendron amurense Rupr. | shade-intolerant | 0.09 | 0.51 | 0.67 | 0.83 | 0.09 | 0.20 | 0.23 | 0.64 |
| Populus davidiana Dode | shade-intolerant | 0.23 | 0.67 | 1.70 | 2.30 | 0.15 | 0.14 | 0.58 | 1.36 |
| Quercus mongolica | shade-intolerant | 0.98 | 1.08 | 1.43 | 1.82 | 0.76 | 0.34 | 0.71 | 1.02 |
| Alnus sibirica (Spach) Turcz. | intermediate | 0.24 | 0.43 | 0.61 | 0.20 | 0.30 | 0.16 | 0.29 | 0.06 |
| Aralia elata (Miq.) Seem. | intermediate | 0.00 | 0.58 | 0.54 | 0.79 | 0.00 | 0.13 | 0.21 | 0.31 |
| Acer mono | shade-tolerant | 0.43 | 1.17 | 1.20 | 1.49 | 0.61 | 0.56 | 0.80 | 0.77 |
| Acer pseudo-sieboldianum | shade-tolerant | 0.20 | 0.97 | 0.44 | 0.93 | 0.46 | 0.68 | 0.20 | 0.43 |
| Acer ukurunduense Trautv. | shade-tolerant | 0.06 | 0.67 | 0.41 | 0.00 | 0.10 | 0.59 | 0.12 | 0.00 |
| Corylus mandshurica Maxim. | shade-tolerant | 0.11 | 0.92 | 0.21 | 0.00 | 0.14 | 0.44 | 0.20 | 0.00 |
| Tilia amurensis Rupr. | shade-tolerant | 0.00 | 0.22 | 0.42 | 0.51 | 0.00 | 0.10 | 0.20 | 0.40 |
| Ulmus laciniata | shade-tolerant | 0.00 | 0.61 | 0.14 | 0.00 | 0.10 | 0.25 | 0.10 | 0.00 |
| Table 5. Volume of regenerated woody species in the forest understory (C), small gaps (S), middle gaps (M), and large gaps (L) in 2006 and 2011. | |||||||||
| Species | Shade tolerance | Volume (m3 m–2) | |||||||
| 2006 | 2011 | ||||||||
| C | S | M | L | C | S | M | L | ||
| Betula costata | shade-intolerant | 0.002 | 0.001 | 0.002 | 0.004 | 0.003 | 0.003 | 0.007 | 0.018 |
| Fraxinus mandshurica | shade-intolerant | 0.004 | 0.004 | 0.004 | 0.007 | 0.007 | 0.012 | 0.014 | 0.039 |
| Fraxinus rhynchophylla | shade-intolerant | 0.004 | 0.003 | 0.004 | 0.007 | 0.006 | 0.006 | 0.006 | 0.014 |
| Juglans mandshurica | shade-intolerant | 0.003 | 0.004 | 0.007 | 0.015 | 0.007 | 0.006 | 0.013 | 0.034 |
| Phellodendron amurense | shade-intolerant | 0.002 | 0.003 | 0.005 | 0.012 | 0.003 | 0.003 | 0.008 | 0.024 |
| Populus davidiana | shade-intolerant | 0.003 | 0.002 | 0.003 | 0.007 | 0.003 | 0.003 | 0.007 | 0.019 |
| Quercus mongolica | shade-intolerant | 0.002 | 0.001 | 0.002 | 0.005 | 0.003 | 0.003 | 0.007 | 0.016 |
| Alnus sibirica | Intermediate | 0.006 | 0.004 | 0.005 | 0.012 | 0.008 | 0.010 | 0.012 | 0.030 |
| Aralia elata | Intermediate | 0.000 | 0.004 | 0.006 | 0.015 | 0.000 | 0.009 | 0.018 | 0.039 |
| Acer mono | shade-tolerant | 0.005 | 0.003 | 0.002 | 0.006 | 0.007 | 0.007 | 0.007 | 0.018 |
| Acer pseudo-sieboldianum | shade-tolerant | 0.003 | 0.003 | 0.002 | 0.005 | 0.007 | 0.008 | 0.008 | 0.017 |
| Acer ukurunduense | shade-tolerant | 0.003 | 0.003 | 0.002 | 0.000 | 0.007 | 0.007 | 0.007 | 0.000 |
| Corylus mandshurica | shade-tolerant | 0.004 | 0.004 | 0.004 | 0.000 | 0.007 | 0.010 | 0.012 | 0.000 |
| Tilia amurensis | shade-tolerant | 0.000 | 0.001 | 0.002 | 0.006 | 0.000 | 0.004 | 0.011 | 0.028 |
| Ulmus laciniata | shade-tolerant | 0.000 | 0.003 | 0.004 | 0.000 | 0.006 | 0.010 | 0.011 | 0.000 |