| Table 1. Characteristics of the study plots. DSH is the diameter at stump height, with the standard deviation shown in parentheses. |
| | Plots on Old site | Plots on New site |
| Properties | 1 | 2 | 3 | 4 | 1 | 2 | 3 | 4 |
| Plot size (m) | 20×50 | 20×50 | 20×50 | 20×50 | 20×80 | 20×80 | 20×50 | 20×50 |
| DSH (mm) | 281 (88) | 258 (82) | 318 (113) | 258 (85) | 331 (109) | 324 (161) | 287 (104) | 289 (107) |
| No. of stumps per plot | 72 | 80 | 78 | 98 | 55 | 65 | 114 | 81 |
| No. stumps harvested per plot | 58 | 71 | 68 | 91 | 48 | 52 | 93 | 76 |
| Density (Stumps ha–1) | 720 | 800 | 780 | 980 | 344 | 394 | 1140 | 810 |
| No. of measured stump holes | 10 | 10 | 10 | 10 | 20 | 13 | 13 | 15 |
| No. of stump heaps | 17 | 15 | 19 | 17 | 13 | 12 | 16 | 12 |
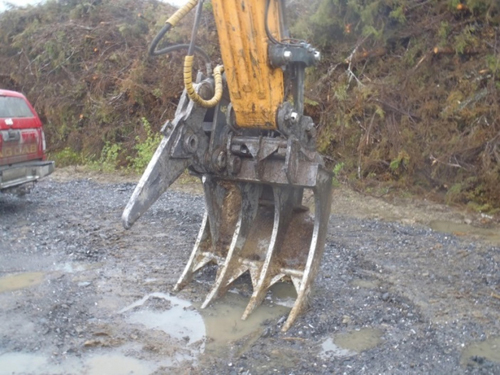
Fig. 1. The Ecorex30 stump harvesting head.
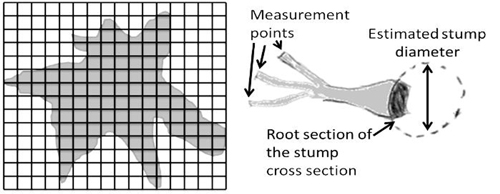
Fig. 2. Left: a mesh (15.4 × 15.5 cm grid size) over the disturbed ground after stump lifting. Right: the measurement points for recording root breakage diameter on one stump piece and the way in which the diameter at stump height was visually estimated from the root section.
| Table 2. Codes and definitions for ground disturbance classes used in the line transect inventory. |
| Code | Disturbance class | Definition |
| 1 | Unaffected ground | Ground unaffected by stump harvest, machine tracks or soil scarification |
| 2 | Vegetation with limited disturbance | Disturbed vegetation but no visible mineral soil |
| 3 | Vegetation on the ground | Vegetation that has been moved and put on top of other vegetation |
| 4 | Soil on the ground | Soil that has fallen onto the vegetation. |
| 5 | Tracks after machine | Tracks that penetrate down to the mineral soil |
| 6 | Stump hole | Area with removed vegetation in the location of a lifted stump |
| 7 | Unclear disturbance | Disturbance down to the mineral soil the origin of which cannot be determined |
| 8 | Soil scarification | Disturbance after soil scarification, both down to mineral soil and in the humus layer |
| 9 | Stump heap or slash pile | Slash or stumps left after forwarding or slash used to prevent rutting |
| Table 3. Means (Value) and standard deviations (std) for variables measured on the sites and the mean (Mean) for the two sites together; Arithmetic mean root breakage diameter (Art), basal area weighted mean root breakage diameter (BAW), Area of disturbed ground (Area), and the depth of stump holes (Depth). |
| | Old | New | Mean |
| Variable | Stump size class (mm) | Value | std | Value | std | Value | std |
| Art (mm) | All | 4.3 | 1.6 | 5.0 | 2.7 | 4.6 | 2.2 |
| 100–199 | 3.9 | 1.0 | 3.7 | 1.3 | 3.8 | 1.1 |
| 200–299 | 4.3 | 1.9 | 5.0 | 2.4 | 4.6 | 2.1 |
| 300–399 | 4.3 | 1.4 | 4.0 | 1.3 | 4.2 | 1.3 |
| 400–499 | 4.5 | 1.8 | 6.5 | 3.8 | 5.9 | 3.1 |
| BAW (mm) | All | 26.4 | 18.4 | 33.5 | 16.4 | 29.5 | 17.9 |
| 100–199 | 13.4 | 2.4 | 14.6 | 8.1 | 14.1 | 6.0 |
| 200–299 | 20.9 | 13.5 | 37.3 | 16.8 | 26.9 | 16.6 |
| 300–399 | 32.5 | 21.8 | 32.9 | 11.2 | 32.7 | 18.7 |
| 400–499 | 34.6 | 17.3 | 40.5 | 16.1 | 37.7 | 16.5 |
| Area (m2) | All | 5.13 | 2.23 | 6.67 | 3.49 | 6.06 | 3.14 |
| <300 | 4.28 | 2.17 | 4.81 | 1.77 | 4.55 | 1.97 |
| >300 | 6.07 | 1.96 | 7.72 | 3.79 | 7.18 | 3.38 |
| Depth (cm) | All | 38.9 | 11.0 | 40.4 | 11.6 | 39.8 | 11.4 |
| Table 4. Correlation analysis between the response variables and the diameter at stump height (DSH). Correlation coefficient = R. ANOVA and ANCOVA tests p-values, adjusted R2 (R2 adj) and covariate (Cov) values. Shapiro-Wilk test for normality of the residuals = S-W, Kruskal-Wallis rank sum test for situations where the residuals were not normally distributed = K-W. Tests were conducted for all stumps and for the different stump size classes: Mean root breakage diameter; arithmetic = Art and basal area weighted = BAW, area of disturbed ground = Area, depth of the stump holes = Depth. |
| | Correlation analysis | ANOVA or ANCOVA | Normality test |
| Variable | Stump size class (mm) | R | p-value | p-value | R2 adj | Cov | S-W | K-W |
| Art (mm) | All | 0.20 | 0.630 | 0.084 | 31.9 | - | 0.116 | - |
| | 100–199 | –0.61 | 0.197 | 0.936 | –24.8 | - | 0.832 | - |
| | 200–299 | 0.23 | 0.621 | 0.291 | 6.1 | - | 0.033 | 0.289 |
| | 300–399 | –0.06 | 0.892 | 0.783 | –15.1 | - | 0.611 | - |
| | 400–499 | –0.20 | 0.633 | 0.752 | –14.6 | - | 0.134 | - |
| BAW (mm) | All | 0.67 | 0.067 | 0.157 | 18.7 | - | 0.228 | - |
| | 100–199 | –0.25 | 0.632 | 0.727 | –20.8 | - | 0.644 | - |
| | 200–299 | –0.12 | 0.792 | 0.068 | 42.3 | - | 0.990 | - |
| | 300–399 | –0.75 | 0.032 | 0.125 | 39.2 | 0.052 | 0.131 | - |
| | 400–499 | –0.51 | 0.192 | 0.971 | –16.6 | - | 0.318 | - |
| Area (m2) | All | 0.73 | 0.042 | 0.670 | 36.4 | 0.136 | 0.096 | - |
| | <300 | 0.05 | 0.901 | 0.459 | 0.00 | - | 0.711 | - |
| | >300 | 0.42 | 0.303 | 0.309 | 3.3 | - | 0.557 | - |
| Depth (cm) | All | 0.50 | 0.211 | 0.639 | 0.00 | - | 0.944 | - |
| Table 5. Least square regression functions for the ground disturbance area (Area) and arithmetic (Art) and basal area weighed (BAW) mean root breakage diameter (RBD) depending on diameter at stump height (DSH). The estimated variable (Estimate), the standard deviation of the estimated variable (Std estimate), the p-value for the estimated variable (p-value), the residual standard error of the function (RMSE) and the adjusted R2 (R2 adj) for the regression function are shown. |
| Predicted variable | Response | | Estimate | Std estimate | p-value | RMSE | R2 adj (%) |
| Area (m2) | LN(Area) | Constant | 0.9720 | 0.1332 | <0.001 | 0.419 | 23.6 |
| DSH (mm) | 0.002203 | 0.0003902 | <0.001 | | |
| RBDART (mm) | LN(RBDART) | Constant | 1.186 | 0.1221 | <0.001 | 0.398 | 2.9 |
| DSH (mm) | 0.0008082 | 0.0003733 | 0.0324 | | |
| RBDBAW (mm) | LN(RBDART) | Constant | 2.821 | 0.1080 | <0.001 | 0.6137 | 11.2 |
| DSH^2 (mm) | 0.000003493 | 0.0000008660 | <0.001 | | |
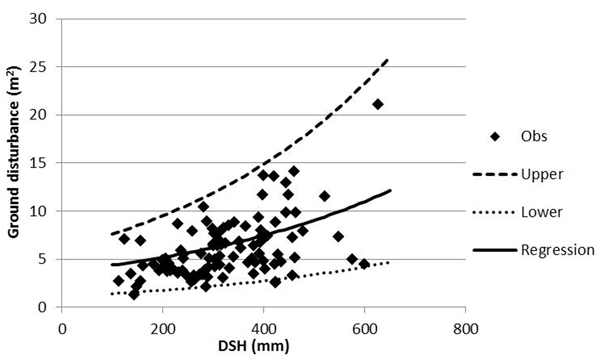
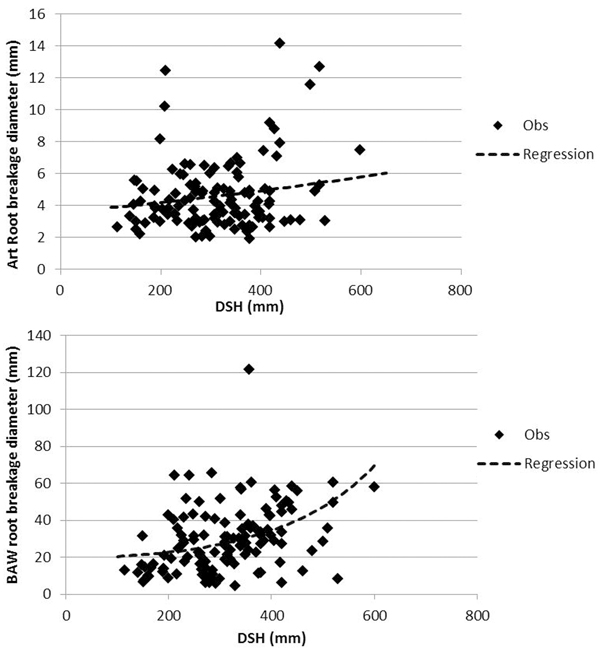
Fig. 3. Measured area of ground disturbance (Obs) plotted against diameter at stump height (DSH), the regression function (Regression) for predicting ground disturbance (Table 5) and the upper (e(1.805+0.002238×DSH)) and lower (e(0.1392+0.002167×DSH)) boundaries for the 95% interval when the regression function is used to predict the ground disturbance.
Fig. 4. Above: measured arithmetic (Art) mean root breakage diameter (Obs). Below: the basal area weighted (BAW) mean root breakage diameter (Obs). Both plotted against diameter at stump height (DSH) and with the transformed regression function (Regression) (Table 5).
| Table 6. Proportion (%) of the ground disturbance classes, 1 unaffected ground, 2 vegetation with limited disturbance, 3 vegetation on the ground, 4 soil on the ground, 5 tracks after machine, 6 stump hole, 7 unclear disturbance down to mineral soil, 8 soil scarification, 9 stump heap or slash pile. |
| | Ground disturbance class | |
| Treatment combination | 1 | 2 | 3 | 4 | 5 | 6 | 7 | 8 | 9 | Total |
| Old site before scarification | 37.3 | 9.4 | 1.9 | 0.9 | 31.9 | 14.8 | 2.8 | NS | 1.1 | 100.0 |
| Old site after scarification | 33.8 | 7.2 | 2.2 | 1.5 | 10.2 | 13.0 | 12.0 | 19.7 | 0.4 | 100.0 |
| New site before scarification | 37.5 | 9.5 | 2.1 | 5.2 | 24.0 | 18.6 | 3.1 | NS | 0.0 | 100.0 |
| New site after scarification | 30.5 | 8.8 | 0.9 | 1.6 | 23.8 | 6.2 | 6.1 | 22.2 | 0.0 | 100.0 |
| Table 7. P-value for ANOVA comparing the arithmetic and basal area weighted (BAW) mean root breakage diameter between different stump size (DSH) classes. |
| | Arithmetic | BAW |
| DSH class (mm) |
| DSH class (mm) | 100–199 | 200–299 | 300–399 | 100–199 | 200–299 | 300–399 |
| 200–299 | 0.577 | - | - | 0.067 | - | - |
| 300–399 | 0.886 | 0.922 | - | 0.006 | 0.732 | - |
| 400–499 | 0.025 | 0.295 | 0.081 | <0.000 | 0.050 | 0.309 |