| Table 1. Results from the beta regression models explaining average ground cover of lichens, bryophytes, eudicots, grasses, total vascular plants (TVP) and no vegetation in stands of native P. sylvestris and P. abies when contrasted to non-native P. contorta. Significant p-values are given in bold. The presented models represent the models with lowest AIC (see Supplementary file 3). The pseudo-R2 value (the squared correlation of the linear predictor and link-transformed response) gives a measure of model fit. | ||||
| Estimate | SE | p-value | Rp2 | |
| Bryophytes | 0.25 | |||
| Intercept | 1.932 | 0.216 | <0.001 | |
| Picea abies | –0.514 | 0.275 | 0.062 | |
| Pinus sylvestris | –0.976 | 0.266 | <0.001 | |
| Age | –0.024 | 0.007 | 0.001 | |
| P. abies × age | 0.030 | 0.008 | <0.001 | |
| P. sylvestris × age | 0.035 | 0.008 | <0.001 | |
| Lichens | 0.37 | |||
| Intercept | –2.946 | 0.905 | 0.001 | |
| Picea abies | –1.198 | 0.992 | 0.227 | |
| Pinus sylvestris | 2.149 | 0.985 | 0.029 | |
| Age | –0.021 | 0.014 | 0.132 | |
| Canopy cover | –0.021 | 0.013 | 0.118 | |
| P. abies × age | 0.022 | 0.016 | 0.181 | |
| P. sylvestris × age | 0.002 | 0.015 | 0.881 | |
| P. abies × canopy cover | 0.007 | 0.017 | 0.665 | |
| P. sylvestris × canopy cover | –0.043 | 0.017 | 0.013 | |
| Eudicots | 0.36 | |||
| Intercept | –0.611 | 0.112 | <0.001 | |
| Picea abies | –0.520 | 0.137 | <0.001 | |
| Pinus sylvestris | –0.343 | 0.135 | 0.011 | |
| Age | 0.015 | 0.002 | <0.001 | |
| Grasses | 0.51 | |||
| Intercept | –2.810 | 0.740 | <0.001 | |
| Picea abies | 0.386 | 0.741 | 0.603 | |
| Pinus sylvestris | 0.527 | 0.770 | 0.493 | |
| Age | 0.022 | 0.015 | 0.137 | |
| Canopy cover | 0.026 | 0.012 | 0.035 | |
| P. abies × age | 0.004 | 0.014 | 0.756 | |
| P. sylvestris × age | –0.035 | 0.010 | <0.001 | |
| P. abies × canopy cover | –0.032 | 0.013 | 0.017 | |
| P. sylvestris × canopy cover | 0.012 | 0.013 | 0.366 | |
| Age × canopy cover | 0.000 | 0.000 | 0.137 | |
| Total vascular plant cover (TVP) | 0.49 | |||
| Intercept | –0.804 | 0.521 | 0.123 | |
| Picea abies | 0.238 | 0.565 | 0.673 | |
| Pinus sylvestris | 0.019 | 0.601 | 0.975 | |
| Age | 0.031 | 0.009 | <0.001 | |
| Canopy cover | 0.011 | 0.008 | 0.145 | |
| P. abies × age | –0.024 | 0.010 | 0.014 | |
| P. sylvestris × age | –0.025 | 0.009 | 0.006 | |
| P. abies × canopy cover | –0.012 | 0.009 | 0.209 | |
| P. sylvestris × canopy cover | 0.009 | 0.010 | 0.369 | |
| No vegetation | 0.68 | |||
| Intercept | –3.788 | 0.498 | <0.001 | |
| Picea abies | 1.928 | 0.442 | <0.001 | |
| Pinus sylvestris | 0.736 | 0.465 | 0.114 | |
| Age | –0.012 | 0.014 | 0.392 | |
| Canopy cover | 0.008 | 0.005 | 0.103 | |
| P. abies × age | 0.003 | 0.015 | 0.859 | |
| P. sylvestris × age | –0.014 | 0.015 | 0.343 | |
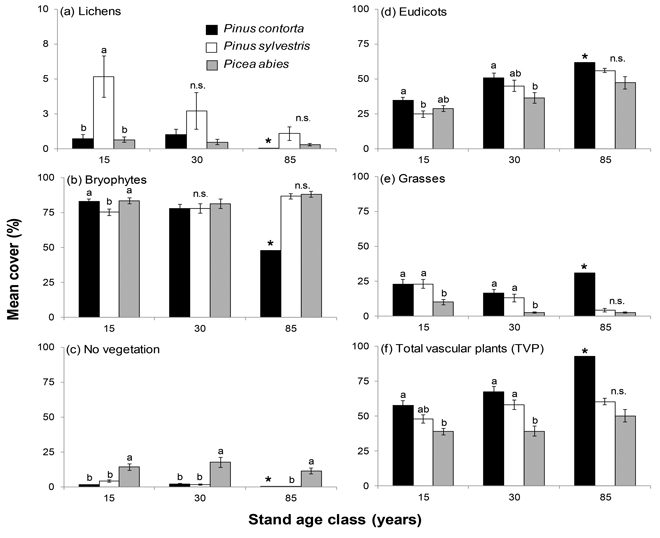
Fig. 1. Mean cover (%), ±SE, for the six different types of ground vegetation inventoried in stands of P. contorta, P. sylvestris and P. abies of different stand age classes. Note the different scales on the y-axes in (a) Lichens. Significant differences within age classes are indicated by different letters (Tukey’s test; p < 0.05), n.s. = not significant. The star (*) denotes the single 85 year old P. contorta stand which was not included in the significance test.
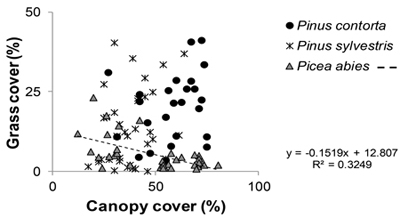
Fig. 2. Relationship between grass cover (%) and canopy cover (%). All stands included. Regression line is shown for Picea abies, the only tree species, under which significant correlation between grass and canopy cover was observed in the beta regression analysis.
| Table 2. Mean values (± SE) for canopy cover in different stand types. Significant differences within age classes are represented by different letters (Tukey’s test; p < 0.05). The star (*) denotes the single 85 year old P. contorta stand which was not included in the significance test. | ||
| Tree species | Age class | Canopy cover (%) |
| P. contorta | 15 | 57 (4.2)a |
| P. abies | 15 | 26 (2.1)b |
| P. sylvestris | 15 | 36 (3.4)b |
| P. contorta | 30 | 62 (2.2)a |
| P. abies | 30 | 58 (4.0)b |
| P. sylvestris | 30 | 40 (3.8)a |
| P. contorta | 85 | 27 * |
| P. abies | 85 | 66 (1.9)a |
| P. sylvestris | 85 | 38 (1.9)b |