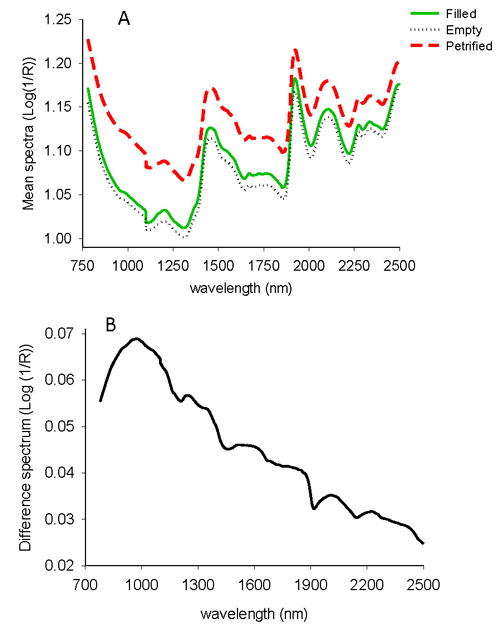
Fig. 1. Average uncorrected NIR spectra of filled-viable, empty and petrified seeds of L. sibirica (A), and difference spectrum of non-viable and viable seeds (B).
| Table 1. A statistical summary of discriminant models computed to classify viable, empty and petrified seeds of L. sibirica into three and two classes. | |||||
| Class | A | R2Xp | R2X0 | R2Y | Q2 cv |
| Three | 2 + 13 | 0.267 | 0.733 | 0.842 | 0.820 |
| Two | 1 + 12 | 0.041 | 0.959 | 0.937 | 0.931 |
| A = number of significant components to build the model (the first and second values represent the number of components for predictive and orthogonal variations, respectively); R2Xp = the predictive spectral variation; R2Xo = Y-orthogonal variation (spectral variation uncorrelated to class discrimination) for the OPLS-DA models; R2Y = the modelled class variation; and Q2cv = the predictive power of a model according to cross validation. | |||||
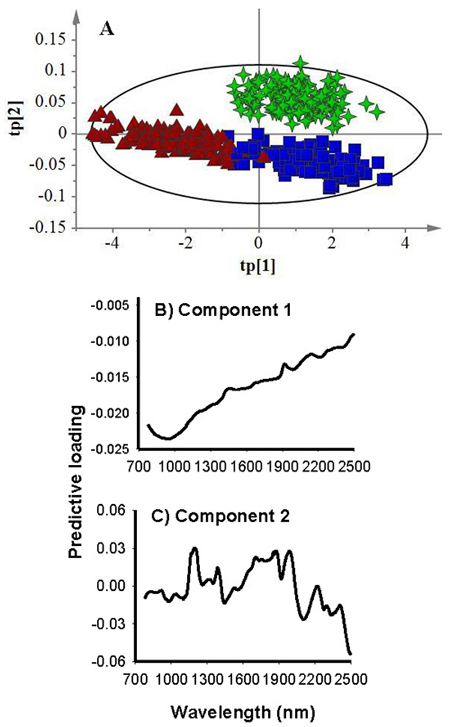
Fig. 2. Score plot for the first (tp[1]) and second (tp[2]) predictive components (A) showing clear clustering patterns of filled-viable (green star), empty (blue box) and petrified (brown triangle) seeds, and loading plots for the first (B) and second (C) predictive components showing absorption bands accounted for class discrimination.
| Table 2. Predicted class membership of viable, empty and petrified seeds in the test sets by three-class OPLS-DA modelling of single seed NIR spectra. | ||||||||||
| Seed lot fractions | No. of test | 1 | 2 | 3 | No class | 1 & 2 | 1 & 3 | 2 & 3 | 1 & 2 & 3 | Classification accuracy (%) |
| Viable (1) | 45 | 44 | 0 | 0 | 1 | 0 | 0 | 0 | 0 | 98 |
| Empty (2) | 45 | 0 | 37 | 5 | 1 | 0 | 0 | 2 | 0 | 82 |
| Petrified (3) | 45 | 0 | 1 | 39 | 4 | 0 | 0 | 1 | 0 | 87 |
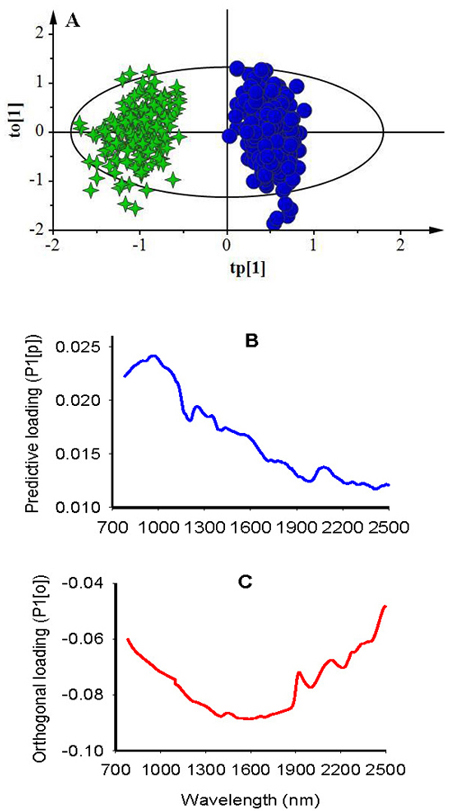
Fig. 3. Score plot for the first predictive (tp[1]) versus orthogonal (to[1]) components showing symmetrical separation of viable (green stars) and non-viable (blue dots) seeds (A); loading plot for the first predictive component (P1[p]) showing absorption bands correlating to seed classes (B); and loading plot for the first orthogonal component (P1[o]) showing absorption bands that are not correlated to class discrimination (C).
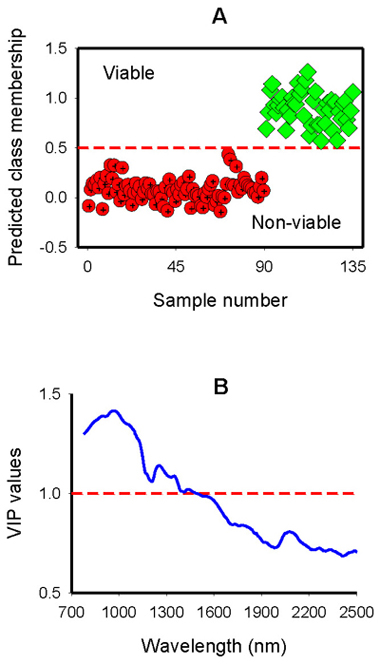
Fig. 4. Predicted class membership of non-viable (empty and petrified) and viable seeds in the test set by two-class OPLS-DA modelling of NIR spectral region (A); and Plot of Variable Influence on Projection, VIP, (B) showing spectral regions that influenced the discrimination of viable from non-viable seeds. The horizontal dotted line in panel A is the class limit (Ypredicted > 0.5) for assigning the test sets into viable class otherwise non-viable, and that in panel B is the cut-off limit (1.0) for discriminating relevant and irrelevant predictors.