| Table 1. Variables considered in the analysis and modelling stage. | ||
| Variable name | Definition and classes | |
| Size (green t) | average piece size of the raw material | |
| Power (kW) | net engine power of the chipper | |
| Season | season of the year when the trial was performed | |
| Moisture | wet ( < 40% – 60%), semi-dry ( > 30% – 40%), dry ( < 30%) | |
| Species | Pinus pinaster, P. pinea, P. adiate, P. nigra, Picea abies, Pseudotsuga menziesii, Populus sp, Quercus cerris, Q. ilex, Castanea sativa, Eucalyptus globulus, E. camaldulensis, E. occidentalis. | |
| Tree part | tops, whips, whole trees, slash | |
| Crew (N) | number of operators working at the same time, divided in 1, 2, or more than 2 | |
| Lay out of the material to be chipped | aligned, bunched, loads, stacked | |
| In feed device | multi-, rollers, table | |
| Comminuter type | discs, drums | |
| Chipper propulsion | self-propulsion, towed, tractor, truck | |
| Feeding | built-in loader, excavator-base loader, manual, self-propelled loader, tractor-mounted loader | |
| Point of comminution | at the landing, on the terrain | |
| Chip discharge | into container, onto a heap, into a trailer, into a truck or into a built-in surge bin | |
| Operator Skills | beginner | limited experience in dealing with chipper operations |
| part-time professional | the involvement of chipper operations is a secondary activity | |
| full time professional | the operator is fully qualified for chipping operations, and those conform their main activity | |
| top professional | the operator is considered to be well above the average after a subjective evaluation in situ | |
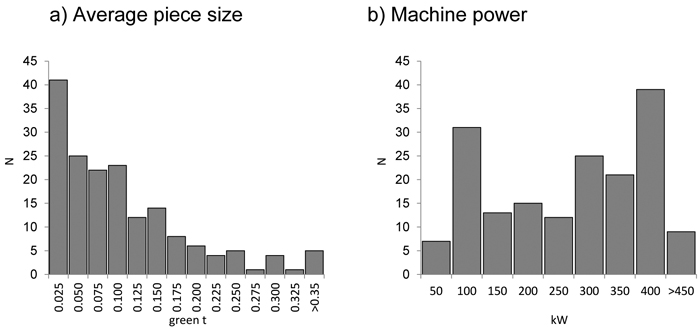
Fig. 1. Distribution of the number of trials (N) concerning a) the average piece size and b) machine power. The upper thresholds of each category are represented in the axis.
| Table 2. Mean, standard error (S.E.) and range of the variables included in the model. (Ntrials = 172, Noperators = 70). P is expressed in pmh (productive machine hours). Size: Average piece size, Power: Chipper power, P: Productivity. | ||||
| Minimum | Maximum | Mean | S.E. | |
| Size (green t) | 0.002 | 0.70 | 0.10 | 0.01 |
| Power (kW) | 22 | 1074 | 251.97 | 11.55 |
| P (green t h–1) | 0.97 | 91.04 | 16.37 | 0.91 |
| Table 3. Resulting p-values based on ANOVA test for the effect of the variables considered on chipper productivity (P), and on the resulting between-operator (μo) and between-trial random factor (eot), as calculated in the model constructed. | |||
| P | μo | eot | |
| Season | 0.005 | 0.862 | 0.301 |
| Moisture | 0.185 | 0.081 | 0.140 |
| Species | <0.001 | <0.001 | 0.810 |
| Tree part | <0.001 | 0.094 | 0.621 |
| Operator Skills | <0.001 | <0.001 | 0.339 |
| Crew (N) | <0.001 | 0.608 | 0.398 |
| Lay Out | <0.001 | 0.378 | 0.189 |
| In feed | 0.002 | 0.002 | 0.081 |
| Comminuter | <0.001 | 0.378 | 0.189 |
| Propulsion | <0.001 | 0.027 | 0.686 |
| Feeding | <0.001 | 0.024 | 0.184 |
| Point of comminution | 0.322 | 0.013 | 0.253 |
| Chip discharge | <0.001 | <0.001 | 0.581 |
| Table 4. Estimates, standard error (S.E.) and significance level of the parameters and variance components of the model constructed. | |||||
| Parameter | S.E. | df | t | p value | |
| Model 1 | |||||
| Intercept | –1.079 | 0.386 | 153.1 | –2.792 | 0.006 |
| lnPOWER | 0.829 | 0.064 | 118.1 | 13.012 | <0.001 |
| lnSIZE | 0.308 | 0.032 | 150.4 | 9.701 | <0.001 |
| (Wald Z) | |||||
| σtrial | 0.070 | 0.010 | 7.062 | <0.001 | |
| σoperator | 0.086 | 0.024 | 3.606 | <0.001 | |
| Table 5. Absolute and relative bias and RMSEs, of the fixed part of the model. Coefficient of determination (R2) of the data transformed and back-transformed for the fixed part and including the operator effect. | ||
| parameter | value | |
| bias (green t h–1) | –0.006 | |
| bias (%) | –0.221 | |
| RMSE | 0.386 | |
| RMSE (%) | 15.414 | |
| Ln scale | back-transformed | |
| R2(fixed part) | 0.85 | 0.76 |
| R2 | 0.94 | 0.88 |
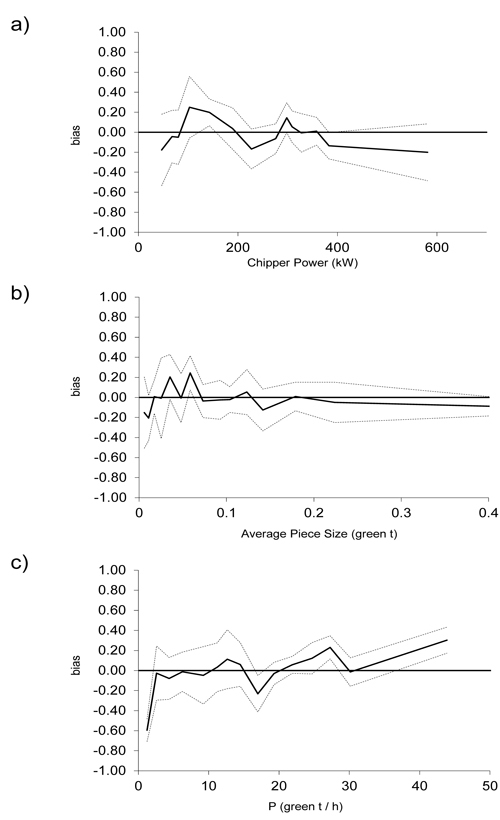
Fig. 2. Mean residuals of the fixed part of the chipper productivity (P) model in green tonnes chipped per hour, as a function of the predicted values, and the variables included: chipper power and average piece size. The mean residuals were grouped in 15 tiles of equal number of observations and dotted lines indicate the 2 x standard error of the mean. The data has been back-transformed and corrected.
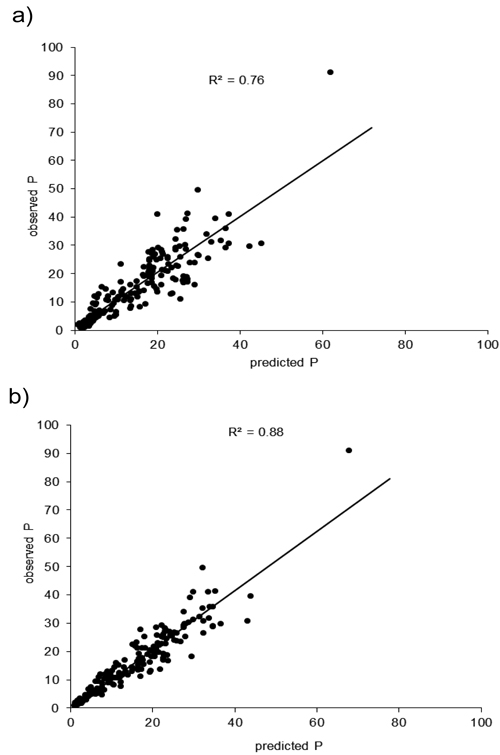
Fig. 3. Predicted and observed estimates resulting from the suggested chipper productivity model, for the fixed effects part a) and the total estimates b). The data was back-transformed and corrected for possible bias. Productivity (P) is measured in green t h–1.
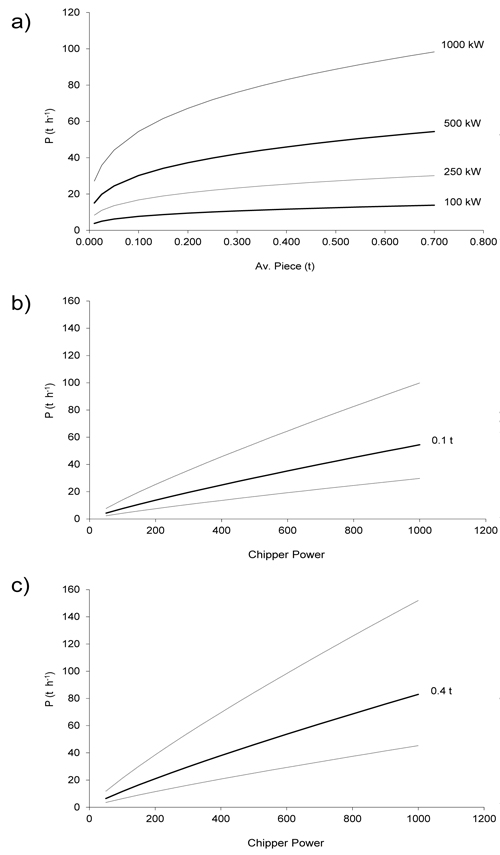
Fig. 4. a) Estimated chipper productivity (P) as a function of average piece size (green t), b) and c) as a function of chipper power (kW). Dotted lines include the operator effect for a given piece size (0.1 or 0.4 green t / piece) and chipper power. This effect was treated as a random effect and the lines include the 95% of the variability due to the operators. The data was back-transformed.
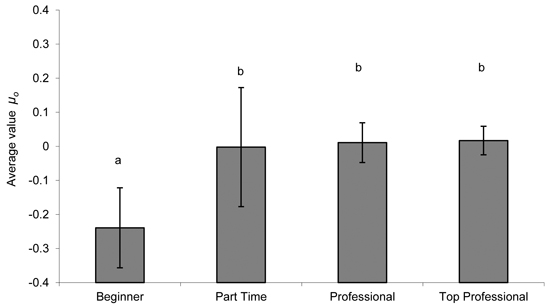
Fig. 5. xAverage values of the operator random factor (µo), compared to their previous experience with chipping. (Values of µo are not back transformed. Lines represent 2 x standard errors of the means. Letters represent the grouping subset resulting of a Duncan test).