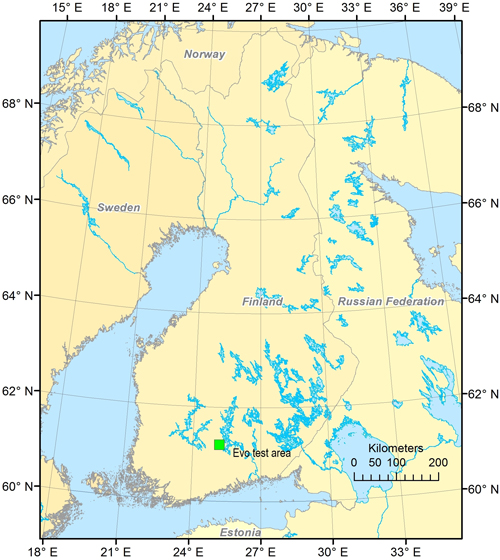
Fig. 1. Location of the test area.
| Table 1. Average, maximum (Max) and standard deviation (Std) of field variables in the field data sets (for all variables: minimum = 0). | ||||||
| 2011 plots (81) | 2012 plots (165) | |||||
| Forest variable | Average | Max | Std | Average | Max | Std |
| Total volume, m3/ha | 215.8 | 529.4 | 110.9 | 213.6 | 653.6 | 119.2 |
| Volume of Scots pine, m3/ha | 76.0 | 314.3 | 80.4 | 77.9 | 314.3 | 80.8 |
| Volume of Norway spruce, m3/ha | 97.2 | 448.9 | 118.9 | 88.3 | 561.3 | 114.2 |
| Volume of broadleaved, m3/ha | 42.7 | 249.9 | 51.6 | 47.4 | 403.4 | 66.9 |
| Mean diameter, cm | 23.5 | 56.2 | 9.9 | 24.1 | 59.1 | 8.8 |
| Mean height, m | 20.2 | 34.7 | 7 | 20.6 | 34.7 | 6.3 |
| Basal area, m2/ha | 22.5 | 46.7 | 9.3 | 22.1 | 56.8 | 9.4 |
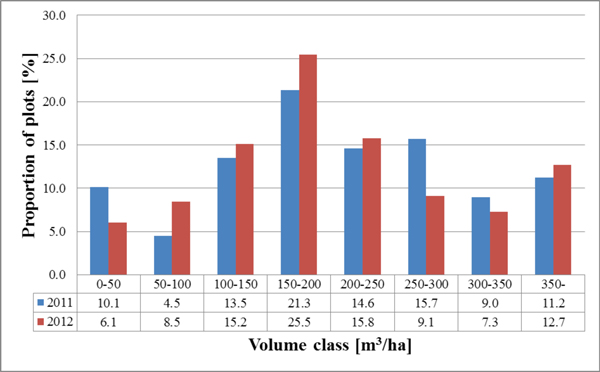
Fig. 2. The volume distribution of the dataset plots used with 2011 and 2012 image acquisition.
| Table 2. Camera sensors fitted to UAVs. | ||
| Camera | Ricoh GR Digital III | Olympus E-420 |
| Sensor type | CCD | CMOS |
| Image sensor size | 17.3 mm ×13.0 mm | 17.3 mm × 13.0 mm |
| Image resolution | 3648 × 2736 pixels | 3648 × 2736 pixels |
| Field of View (FOV) | 65° × 51° | 38.1° × 29.1° |
| Pixel size | 4.74 µm | 4.74 µm |
| Groud sample distance* | 5.2 cm | 8.5 cm |
| Spectral bands** | 490 – 600 nm 600 – 700 nm 700 – 1000 nm | 490 – 600 nm 600 – 700 nm 700 – 1000 nm |
| Frame rate | 0.25 Hz | 0.5 Hz |
| Weight | 220 g | 380 g |
| Size | 109 × 60 × 26 mm | 129.5 × 91 × 53 mm |
| *At the applied flying altitude **Both Ricoh and Olympus had a blue cutting filter Schott GG495 which has a cut-off wavelength 495 nm. | ||
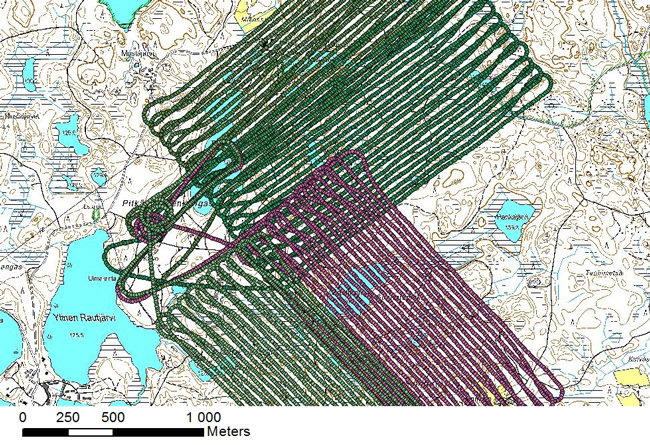
Fig. 3a. UAV flight lines of the 2012 photo acquisition. The take-off and landing site is located approximately 300 m north-east of Ylinen Rautjärvi (approach and descent curves made by the UAV prior to landing can be seen on the map).
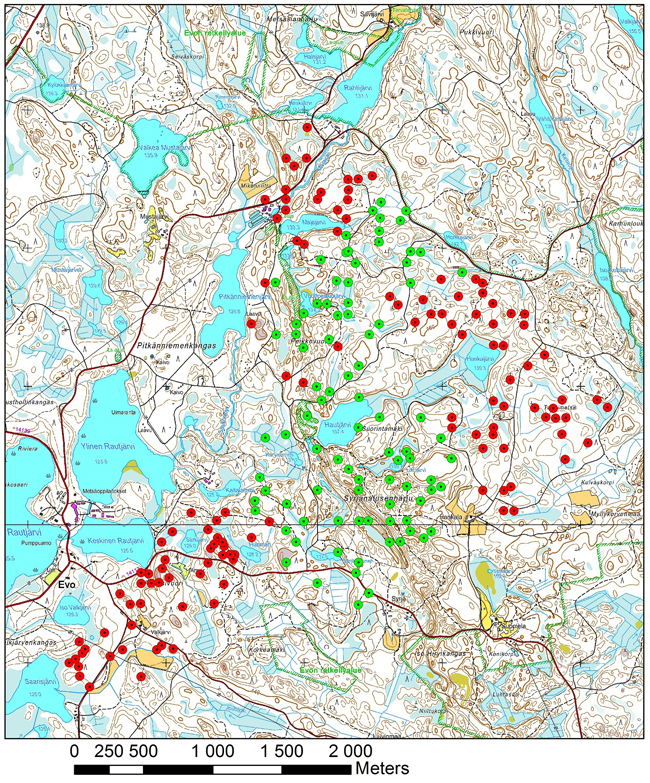
Fig. 3b. Location of field plots of 2011 (green) and 2012 (red).
| Table 3. UAV systems (Trimble unmanned aircraft systems 2013, Bramor UAS family 2013). | ||
| UAV | Gatewing X100 | C-Astral Bramor |
| Wing span (cm) | 100 | 230 |
| Fuselage length (cm) | 60 | 96 |
| Take-off weight (kg) | 2.2 | 4.2 |
| Payload | compact camera | 0.6 – 1.0 kg |
| Propulsion type | electric | electric |
| Take-off/landing | catapult launch/belly landing | catapult launch/parachute landing |
| Flight endurance (min) | 45 | 120 |
| Altitude ceiling (m) | 2500 | 5000 |
| Table 4. The feature combinations selected by GA for estimating forest variables based on data of 20 and 50 cm spatial resolutions (DBH = diameter at breast height, v. = volume of growing stock, for feature abbreviations see section 2.4). | |
| Height (20 cm) | STD_G, H05, H30, H80, H85, H95, HCV, VEG, P60, IDM_R, MOC_G, MOC_H, SV_H |
| Height (50 cm) | STD_G, HAVG, H30, H40, H85, H95, H100, P40, DV_R, MOC_G, MOC_H, SV_H |
| DBH (20 cm) | HSTD, H0, H90, H95, H100, P20, P60, MOC_NIR, ASM_R, ENT_G, DE_H, MOC_H |
| DBH (50 cm) | H30, H90, H100, P60, P95, SA_G, COR_H, MOC_H, SA_H |
| Basal area (20 cm) | HAVG, H20, H40, H80, H90, D3, ENT_NIR, SV_R, ASM_G, ASM_H, CON_H |
| Basal area (50 cm) | HSTD, H20, H40, H70, H80, D2, P40, DE_NIR, SV_R, CON_H, DE_H, MOC_H |
| V. total (20 cm) | HSTD, H10, H70, H80, H85, H90, H95, D0, P60, SA_R, CON_H, DV_H |
| V. total (50 cm) | HAVG, HSTD, H20, H30, H90, P20, DE_NIR, SA_R, ASM_H, CON_H |
| V. pine (20 cm) | MEAN_NIR, H20, H80, H85, H95, D2, D6, D9, P60, COR_NIR, DE_NIR, IDM_H, SV_H |
| V. pine (50 cm) | STD_G, H20, H40, H80, H85, H95, HCV, VEG, P80, PCG, DV_NIR, SE_R, CON_G, DV_G, SE_G, IDM_H, MOC_H |
| V. spruce (20 cm) | MEAN_NIR, HSTD, H40, H70, H100, D3, P80, IDM_H |
| V. spruce (50 cm) | MEAN_NIR, STD_G, HSTD, H20, H050, H80, H95, HCV, D3, ASM_R, IDM_R, ASM_G, DE_G, CON_H, IDM_H, MOC_H |
| V. broadleaf (20 cm) | HSTD, H0, H40, H80, H90, D2, D8, PGH, SV_NIR, COR_G, ASM_H, IDM_H, SA_H, VAR_H |
| V. broadleaf (50 cm) | STD_R, H050, H85, H100, D8, P95, ASM_NIR, ASM_R, COR_R, SA_R, MOC_G, CON_H, COR_H, MOC_H, VAR_H |
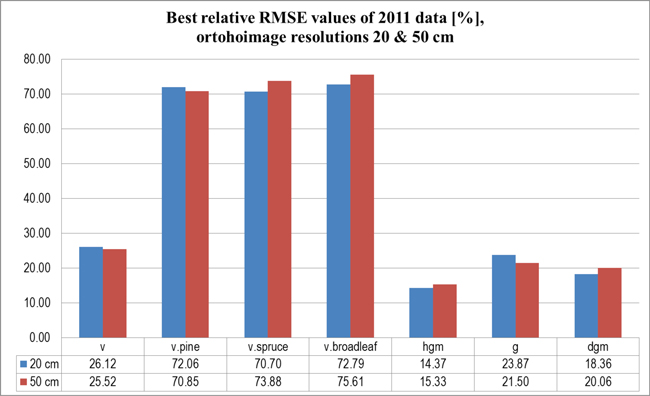
Fig. 4. Relative RMSE values [%] for estimated forest variables at sample plot level (2011 data, orthoimage resolutions 20 and 50 cm). Variables: v = volume, g = basal area, hgm/dgm = mean height/diameter (as measured from basal-area weighted median tree).
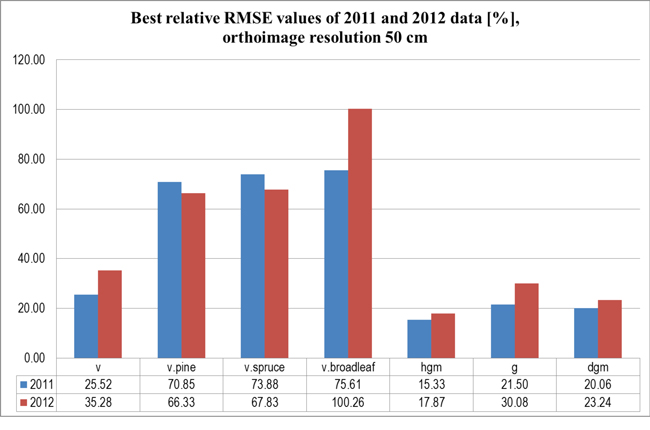
Fig. 5. Relative RMSE values [%] for estimated forest variables at sample plot level (2011 and 2012 data, orthoimage resolution 50 cm).