| Table 1. Description of experimental treatments, including soil depth for incubation of needle and root litter. | |||
| Treatment | Description of treatment | Incubation depth | |
| Needle litter | Root litter | ||
| Control (CON) | Undisturbed reference | 0 cm | 5 cm |
| Exposed mineral soil (EMS) | Removal of humus layer (5 cm) and the top 2 cm of mineral soil | 0 cm | 0 cm |
| Double humus layer (DHL) | Removed layers from EMS were inverted and placed on undisturbed soil | 7 cm* | 7 cm* |
| Mixed soil (MIX) | Humus layer and mineral soil were mixed to a depth of 30 cm | 5 cm | 5 cm |
| * Between the humus layers | |||
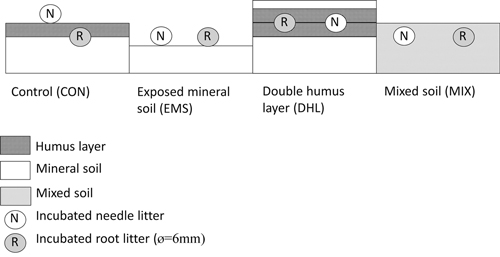
Fig. 1. Schematic diagram of the disturbance created by each of the treatments – control (CON), exposed mineral soil (EMS), double humus layer (DHL), and mixed soil (MIX) – showing locations in the soil profile of the incubated litterbags containing needle (N) and root (R) litter.
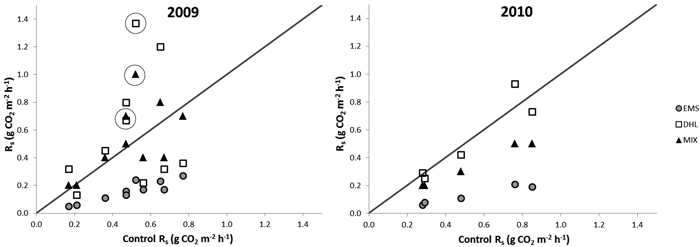
Fig. 2. Soil-surface CO2 fluxes (Rs) from exposed mineral soil (EMS), double humus layer (DHL), and mixed soil (MIX) plots (Y-axis) versus fluxes from control plots (X-axis) in 2009 and 2010. Points above the diagonals show fluxes that were higher than controls. The circles mark fluxes recorded on the first two occasions (within 2 weeks) after the MIX and DHL treatments, which indicate a possible initial increase in Rs.
| Table 2. Mean and standard error (SE) of soil-surface CO2 fluxes (Rs, g CO2 m–2 h–1), soil temperatures at 0–10 cm depth and soil moisture contents at 0–5 cm depth recorded in the control (CON), exposed mineral soil (EMS), double humus layer (DHL) and mixed soil (MIX) plots at Åmot at indicated dates. Differences in the letters a, b, and c denote significant between-treatment differences in the Rs and soil temperature values (p ≤ 0.05) at corresponding dates. As the measurements pertaining to the first date (2009-06-10) were acquired before the soil was treated (2009-06-16) they are not included in the means for 2009. Missing values are denoted m.v. View in new window/tab. |
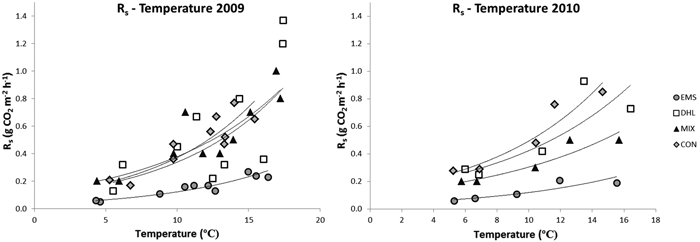
Fig. 3. Correlations between soil-surface CO2 fluxes (Rs) and soil temperatures in the control (CON), exposed mineral soil (EMS), double humus layer (DHL), and mixed soil (MIX) plots in 2009 and 2010. The curves represent the exponential trend lines, with the following regression coefficients (R2). Curves in the left figure (2009): CON; Rs = 0.09e0.14T (R2 = 0.8), DHL; 0.09e0.13T (R2 = 0.5), MIX; Rs = 0.1e0.11T (R2 = 0.8), EMS; Rs = 0.03e0.13T (R2 = 0.9). Curves in the right figure (2010): CON; Rs = 0.13e0.13T (R2 = 0.9), DHL; 0.13e0.12T (R2 = 0.8), MIX; Rs = 0.10e0.11T (R2 = 0.9), EMS; Rs = 0.04e0.12T (R2 = 0.9).
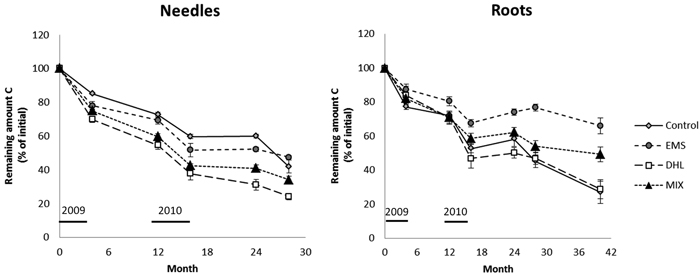
Fig. 4. Decomposition, expressed as the proportion (%) of C remaining in the needle and root litter incubated in control (CON), exposed mineral soil (EMS), double humus layer (DHL), and mixed soil (MIX) plots. The initial C content in the needle and roots was 55%. Incubation started in June 2009 (month 0), so January is represented by months 7, 19, and 31. The black bars just above the X-axis indicate the time-periods when soil-surface CO2 flux (Rs) measurements were acquired. Errors bars show standard errors.
| Table 3. Differences in remaining amounts of C, N and δ15N in the needle and root litter between plots subjected to the control (CON), exposed mineral soil (EMS), double humus layer (DHL), and mixed soil (MIX) treatments. Differences in the letters a, b, c denote significant between-treatment differences (p ≤ 0.05) in indicated months. For averages and standard error, see Fig. 4–6. | |||||||||
| Month since incubation | Needles | Roots | |||||||
| CON | EMS | DHL | MIX | CON | EMS | DHL | MIX | ||
| Remaining C | 4 | a | ab | b | b | a | a | a | a |
| 12 | a | ab | c | bc | a | a | a | a | |
| 16 | a | ab | c | bc | ab | b | a | ab | |
| 24 | a | a | b | b | ab | b | a | ab | |
| 28 | a | a | b | ab | a | b | a | a | |
| 40 | a | b | a | ab | |||||
| Remaining N | 4 | a | a | b | a | a | a | a | a |
| 12 | a | a | b | a | a | a | a | a | |
| 16 | a | a | b | ab | a | a | a | a | |
| 24 | ab | a | a | a | a | a | a | a | |
| 28 | a | a | a | a | a | a | a | a | |
| 40 | a | b | ab | ab | |||||
| δ15N | 4 | a | b | ab | b | a | a | a | a |
| 12 | a | b | b | b | a | a | a | a | |
| 16 | a | ab | b | b | a | a | a | a | |
| 24 | a | b | b | b | a | a | a | a | |
| 28 | a | b | b | b | a | ab | b | ab | |
| 40 | a | a | a | a | |||||
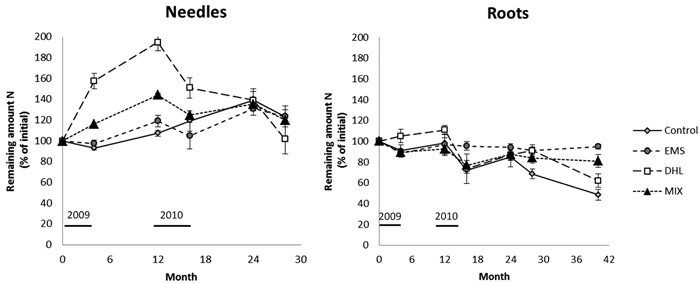
Fig. 5. Decomposition expressed as the remaining N amount in the needle and root litter for the control (CON), exposed mineral soil (EMS), double humus layer (DHL), and mixed soil (MIX) treatments. The initial N content in the needle and roots was 0.47% and 0.37%, respectively. Incubation started in June 2009 (month 0), and January is represented by month 7, 19, and 31. Black lines represents the time-period when soil-surface CO2 flux (Rs) measurements were conducted. Bars denote the size of standard errors.
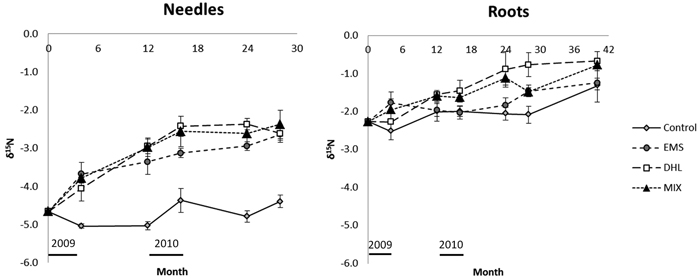
Fig. 6. Changes with time of δ15N in the needle and root litter incubated in control (CON), exposed mineral soil (EMS), double humus layer (DHL), and mixed soil (MIX) plots. Incubation started in June 2009 (month 0), so January is represented by months 7, 19, and 31. The black bars just above the X-axis indicate the time-periods when soil-surface CO2 flux (Rs) measurements were acquired. Error bars show standard errors.