| Table 1. The infraspecific taxa of Pinus nigra from the central Balkans used in the present study, characteristics of sampling localities, and estimates of chloroplast microsatellite (cpDNA SSR) and mitochondrial (mtDNA) diversity. View in new window/tab. |
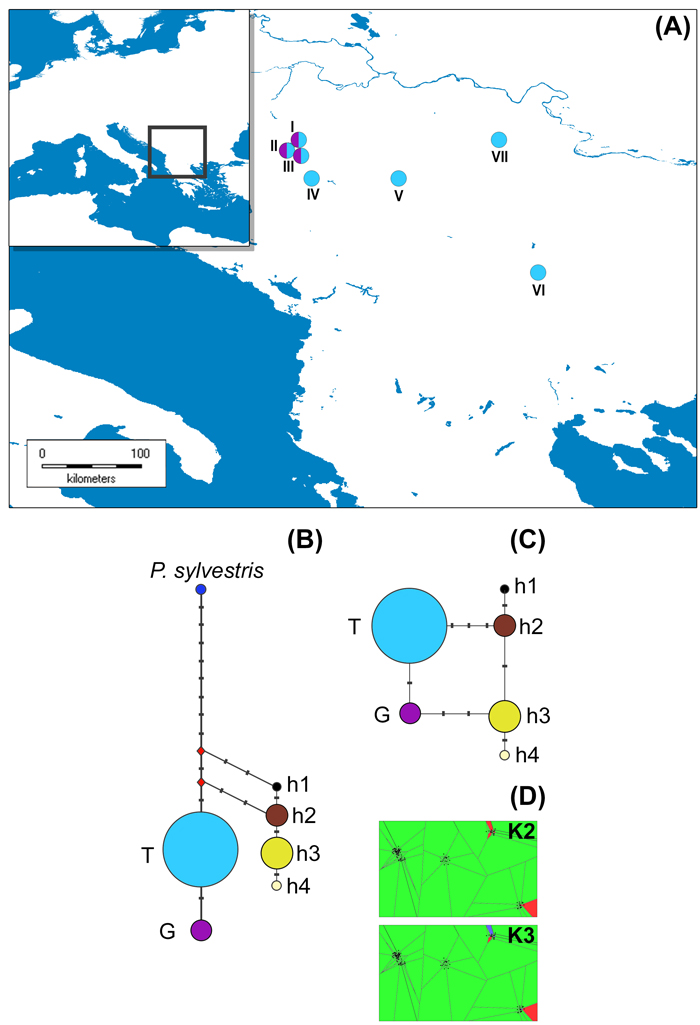
Fig. 1. The distribution of studied P. nigra populations within the central Balkans and the abundance of mtDNA haplotypes (A), haplotype networks based on mitochondrial data (B and C) and outcomes of TESS analyses based on chloroplast data (D).
Populations I, II and III represent P. nigra ssp. nigra var. nigra, populations IV and V represent P. nigra ssp. nigra var. gocensis, population VI represents P. nigra ssp. pallasiana var. pallasiana, and population VII represents P. nigra ssp. pallasiana var. banatica (see also Table 1); the size of circles in haplotype network rooted with P. sylvestris (B) and unrooted haplotype network (C) is proportional to the relative frequency of haplotypes T and G in eastward populations (see Table 1), and haplotypes h1 to h4 in westward populations, but the relative frequency of haplotypes in these regions is not comparable; mtDNA haplotype labels are given in the legend of Table 2; D – clustering of populations at K = 2 and K = 3 using TESS.
| Table 2. Positions of variable sites in 991 bp long aligned mtDNA nad7 intron1 matrix comprised of six Pinus nigra haplotypes and three Pinus sylvestris haplotypes used as an outgroup. View in new window/tab. |