| Table 1. Biomass removal and changes in ground water level (GWL) recorded in indicated studies. | |||
| Biomass removal 1 | Δ GWL 2 (cm) | Note 3 | Reference |
| Partial removal, peat soils | |||
| PCT (from 3.5–10.4 m2 ha–1 to 0.4–2.5 m2 ha–1) | c. 2 | Mean rise from June to August, during 2 years monitored. A.b. and L.l. dominated stands at 4 sites in Quebec, Canada (organic top layer > 50 cm). | Jutras et al. 2006 |
| TBA 20–50% | 1.7 – 2.3 cm. | P.s. on 4 drained peat (depth > 90 cm) sites in N Finland. IS 70–110 m3 ha–1. | Hökkä and Penttilä 1995 |
| TVO 10% TVO 15%, 28% | ± 0 ≤ 7 | P.s. on a drained bog in S Finland. IS = c. 95 m3 ha–1. | Päivänen and Sarkkola 2000 |
| TBA 0%, 20%, 30%, 50% | c. 2–5 (data from figure). GWL lowest in 0% and highest in 50%; non-significant differences. | Drained P.a. mire in E Finland. IS 200–350 m3 ha–1. DC concurrently with T. | Hökkä et al. 2000b |
| T 17%, T 26% | 0–15 The heavier cutting the larger the GWL change. | Mature P.s. and P.a. stands on drained peat in S Finland with volumes of 107–120 m3 ha–1 (P.s.) and 137–198 m3 ha–1 (P.a.). | Päivänen 1982 |
| T 17% T 30% | 0–9 5–15 | P.s. (IS = 110–120 m3 ha–1) N.s. (IS = 140–200 m3 ha–1) in drained peatlands. | Päivänen 1980 |
| T 20–50% | A few cm, but clearly discernible. | Seven exp. in P.s. and B.spp. in drained peatlands in central Finland. IS = 50–150 m3 ha–1. | Heikurainen 1967 |
| T 20%, 40% T 60% | 0–4 5–7 | P.s. in a drained peatland in central Finland. IS = c. 90 m3 ha–1. | Heikurainen and Päivänen 1970 |
| T (SC) | 2–13 | Four P.a. stands on mires in central Sweden. Mean of three years after harvest. | Lundin 2000 |
| Partial removal, mineral soils | |||
| PCT (from 3.5–10.4 m2 ha–1 to 0.4–2.5 m2 ha–1) | 1.5–3 | Mean rise from June to August, during 2 yrs monitored. A.b. and L.l. dominated stands at 2 sites in Quebec, Canada (organic top layer < 20 cm). | Jutras et al. 2006 |
| T 0%, 40%, 50%, 60% | GWL rise linearly related to cutting percentage. | P.r. and A.b. dominated stand on gleyed humoferric podzol (organic top layer c. 10 cm) in Quebec, Canada. IS = 40 m3 ha–1. | Pothier et al. 2003 |
| Final cutting, peat soils | |||
| FC | 4 | Organic soil. | Marcotte 2005 (in Jutras et al. 2006) |
| FC | 2–27 | P.s. (IS = 110–120 m3 ha–1) and P.a. (IS = 140–200 m3 ha–1). | Päivänen 1980 |
| FC | 20–40 | Seven exp. in P.s. and B.spp. in drained peatlands in central Finland. IS = 50–150 m3 ha–1. | Heikurainen 1967 |
| FC | 5–14 cm | P.s. in a drained peatland in central Finland. IS = c. 90 m3 ha–1. | Heikurainen and Päivänen 1970 |
| FC | c. 22 cm | P.r. and A.b. dominated stand on gleyed humoferric podzol (organic top layer c. 10 cm) in Quebec, Canada. IS = 40 m3 ha–1. | Pothier et al. 2003 |
| FC | No significant GWL rise after shelterwood removal relative to some years after shelterwood cut. | FC of shelterwoods, treatments 40%, 50%, 60% in the study by Pothier et al. (2003) See above. | Prévost and Gauthier 2013 |
| FC | 4–11 | Four P.a. stands on peatlands in central Sweden. Mean of three years after harvest. | Lundin 2000 |
| FC | 18 (12–37 within site variation) | P.s. on a drained peatland in S Finland. IS = 100 m3 ha–1. | Sarkkola et al. 2013 |
| FC | 17 | P.a. on peatland in Sweden. IS = 300–400 m3 ha–1. | Lundin 1999 |
| FC | No GWL rise at 20 m ditch distance. At 40 and 60m ditch distances GWL rise occurred 10–30 m away from the ditches. | P.m. dominated stand on a fen with highly humified peat as top soil (100 cm) in Quebec, Canada. IS = 60 m3 ha–1. | Jutras and Plamondon 2005 |
| FC | 4–7 | Five fens, bogs and swamps (peat thickness > 30 cm). Study in Quebec, Canada, in a flat lowland forested wetland area with poor drainage. A variety of tree species included, e.g. A.b., P.r., P.m., A.r. and T.o. | Dubé et al. 1995; Dubé and Plamondon 1995 |
| FC | 12–16 cm, depending on total removed volume | Mature P.a. and P.s. stands in southern Finland, volumes removed 138 m3 ha–1 and 114 m3 ha–1. | Päivänen 1982 |
| Final cutting, mineral soils | |||
| FC | 10 | Mineral soil. | Marcotte 2005 (in Jutras et al. 2006) |
| FC | 20 | Two gleyed mineral soil sites (thickness of organic layer 10–30 cm). Study in Quebec, Canada, in a flat lowland forested wetland area. A.b. and P.r. dominated stands. | Dubé et al. 1995; Dubé and Plamondon 1995 |
| FC | 31 | Mean during 4 years after harvest. P.s. and P.a. dominated stands (IS = 100–200 m3 ha–1) on upland morainic mineral soil in central Sweden. | Lundin 1979 |
| 1 PCT = Pre-commercial thinning; T = Thinning; TBA = Thinning by stem basal area; TVO = Thinning by stem volume; SC = Shelterwood cut; FC = Final cutting. | |||
| 2 Commonly given as mean change in ground water level (GWL) over the vegetation period. | |||
| 3 IS = Initial stocking before harvest; DC = Ditch cleaning; A.b. = Abies balsamea (L.) Mill.; L.l. = Larix laricina (Du Roi) K. Koch; P.s. = Pinus sylvestris L.; P.a. = Picea abies (L.) H. Karst.; P.r. = Picea rubens Sarg.; P.m. = Picea mariana (Mill.) Britton, Sterns & Poggenb.; B.spp. = Betula spp.; A.r. = Acer rubrum L.; T.o. = Thuja occidentalis L. | |||
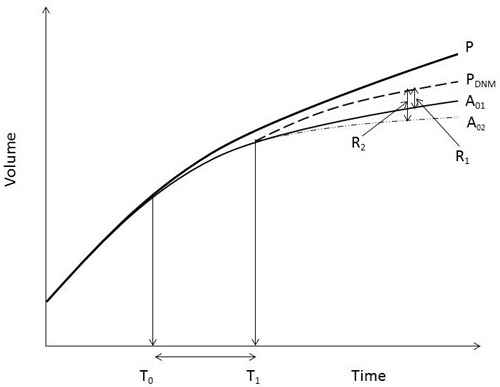
Fig. 1. A schematic figure on stand stem volume development under different assumed site water conditions. P = potential volume development if there is no need for ditch network maintenance (DNM) operation. A01, A02 = alternative development after time point T0, when soil water conditions begin to limit growth moderately (A01) or severely (A02). T1-T0 is the period of sub-optimal growth for senarios A01 and A02. PDNM = potential development if DNM operation is carried out at time point T1. R1 and R2 represent growth reponses of DNM in relation to the two senarios with growth limitation without DNM.
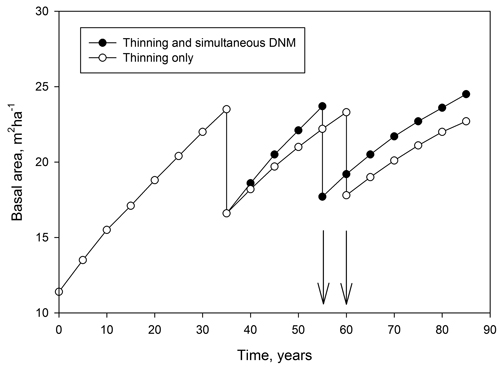
Fig. 2. An example of the impact on basal area development of ditch network maintenance (DNM) operation for a management schedule of a peatland stand when DMN is conducted at the time of first commercial thinning (basal area 12 m2 ha–1 at the start of the simulation). Without DNM the second thinning will be done five years later (see arrows) due to the lower growth rate of trees. Earlier incomes from thinning generally improve the profitability of the schedule including DNM. Data generated by the simulation program MOTTI (Hynynen et al. 2002).