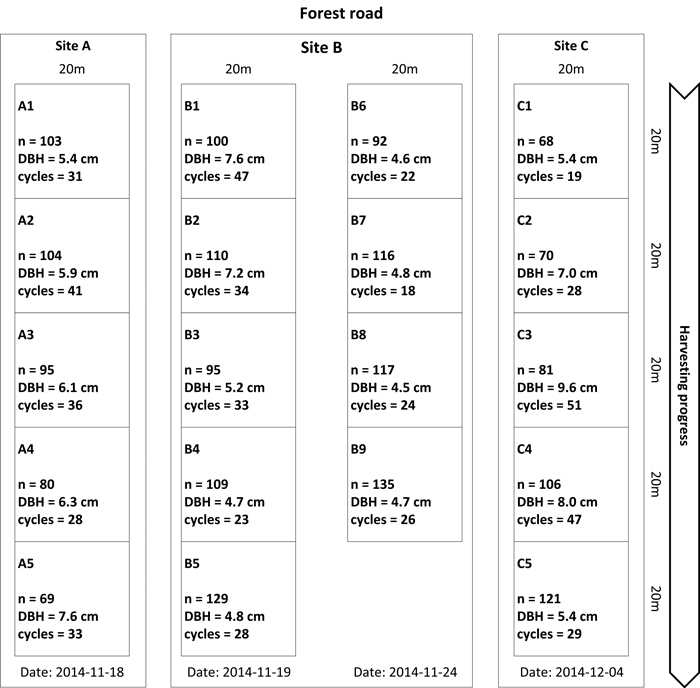
Fig. 1. Study layout of the EF28 time study. Nineteen 400 m² plots were situated in three different stands (A, B and C). The direction of harvesting progress is displayed on the right. Plot information includes the number (n) of trees harvested per plot, the mean diameter at breast height per plot (DBH) and the number of crane cycles required for finishing this plot (cycles).
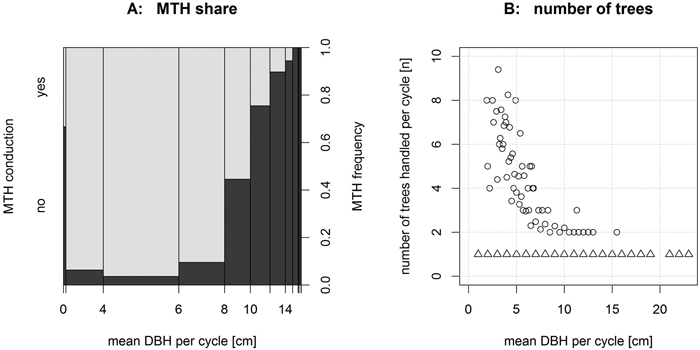
Fig. 2. A: The total share of multi-tree handling operations (MTH) (light grey) decreases with increasing DBHmean of trees harvested per cycle. B: Consequently, the number of trees (circle shaped symbols) handled per cycle decreases with increasing DBH. For a DBHmean of more than 16 cm, only single-tree handling operations (triangle shaped symbols) were recorded.
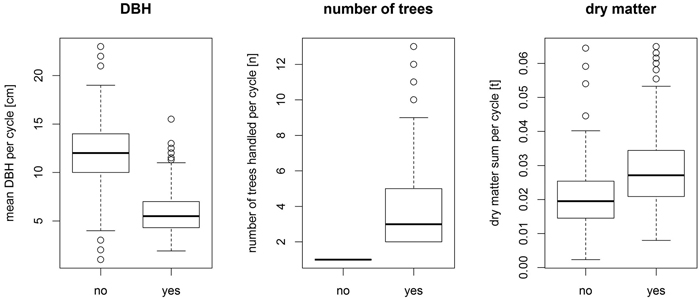
Fig. 3. Effect (yes = multi-tree handling conducted, no = single-tree handling conducted) of multi-tree handling on the operation’s parameters.
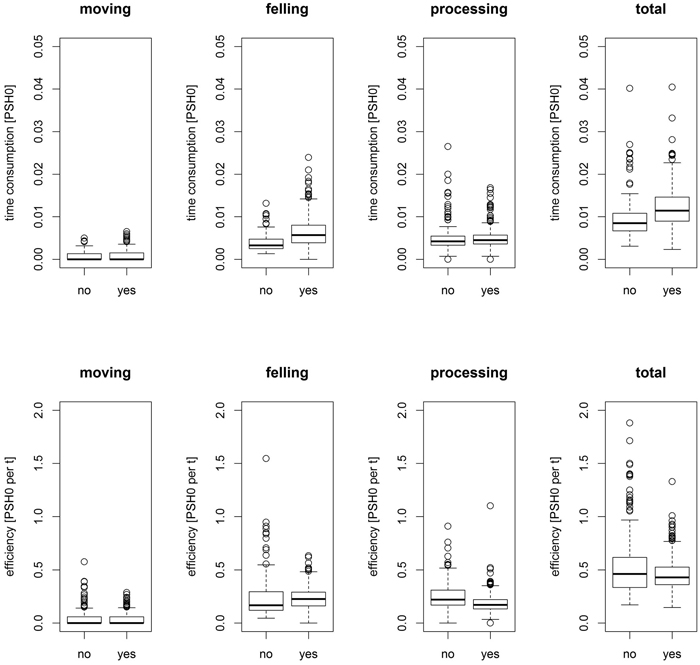
Fig. 4. Effect of multi-tree handling (yes = multi-tree handling conducted, no = single-tree handling conducted) on the time consumption (top) and efficiency (bottom) of the main work elements and in total.
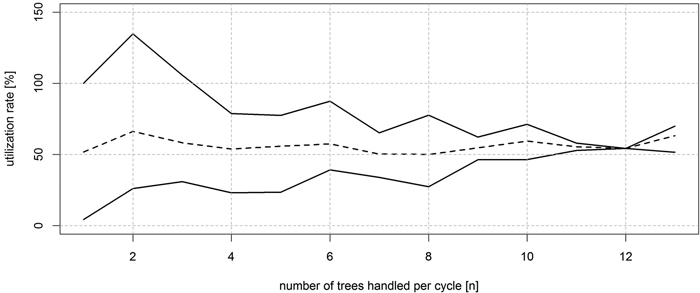
Fig. 5. Utilization rate of the theoretical physical multi-tree handling capacity, which is expressed by the relation of the cumulated circular area of the tree’s diameter handled during a cycle to the theoretical maximum circular area that can be handled by the head. Solid lines represent the upper (top) and lower (bottom) limit, while average utilization rate is displayed as dashed line.
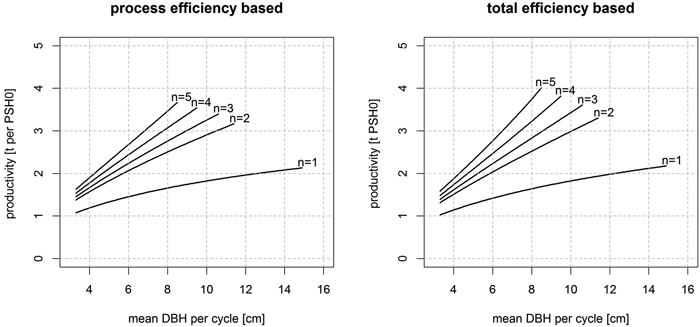
Fig. 6: The productivity of the EF28 for different numbers (n) of trees per cycle and mean diameter at breast height (DBH) per cycle.