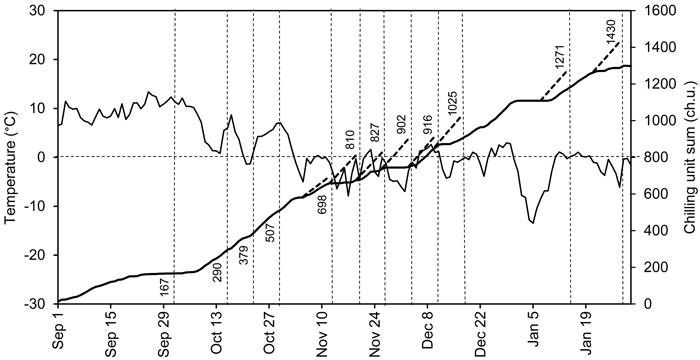
Fig. 1. Average daily air temperatures (solid fluctuating curve) and the chilling unit sum based on hourly temperature measurements in outdoor conditions (solid ascending curve) at Punkaharju, Finland (61°48´N, 29°19´E), from September 1, 2007 to January 31, 2008. Dashed vertical lines indicate the transfers, i.e., the time points at which the seedlings were moved to forcing conditions. The attached figures indicate the corresponding accumulated chilling unit sums. The dashed ascending lines indicate the chilling units that accumulated in the preforcing conditions for one week. The dashed horizontal line indicates a temperature of 0 °C and chilling unit sum of 800 ch.u.
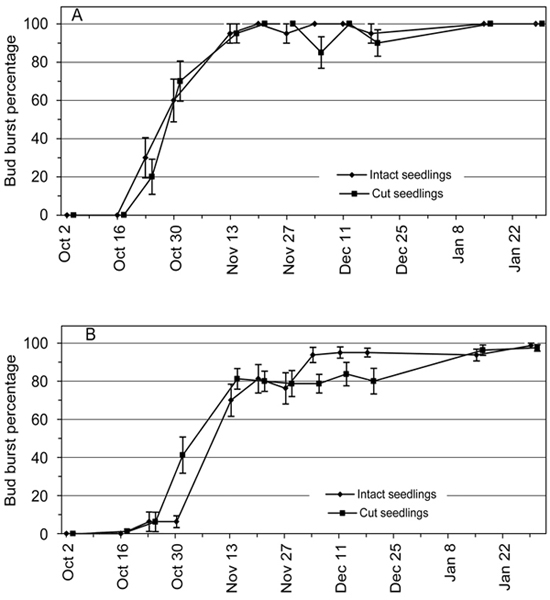
Fig. 2. Bud burst percentage (BB%) of 2-year-old Norway spruce seedlings in relation to the 12 transfer times from the natural and preforcing (transfers from 13 November onwards) conditions to the forcing conditions. BB% is shown separately for the intact seedlings and the seedlings where the root connection was cut by detaching the shoot from the root system. Bars = standard error of mean. (A) Terminal bud; (B) four uppermost lateral buds of the seedling.
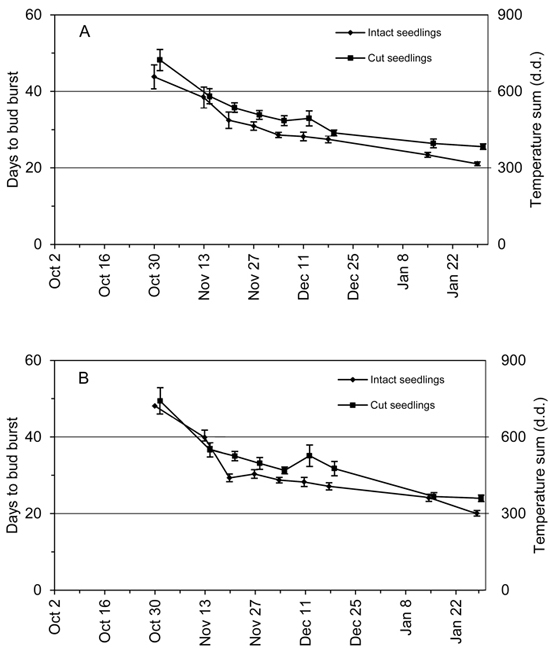
Fig. 3. Average days to bud burst (DBB) of 2-year-old Norway spruce seedlings in relation to the time of transfer from the natural and preforcing (transfers from 13 November onwards) conditions to the forcing conditions. DBB is shown separately for the intact seedlings and the seedlings where the root connection was cut by detaching the shoot from the root system. Bars = standard error of mean. (A) Terminal bud; (B) bud burst of at least two out of four uppermost lateral buds of the seedling. The vertical axis on the right indicates the approximate temperature sum in forcing conditions corresponding to the DBB.