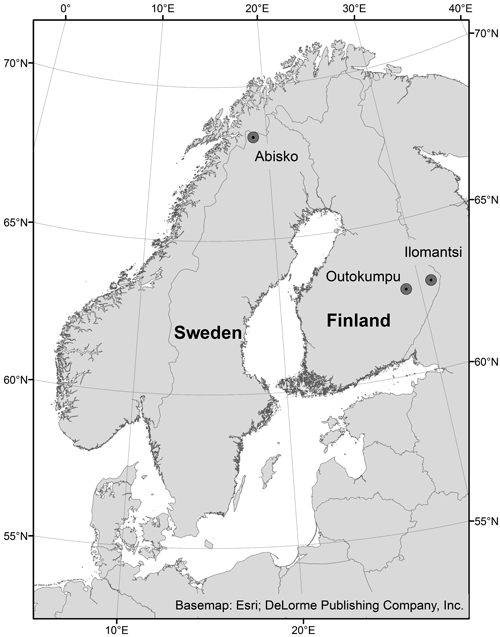
Fig. 1. The two study areas in Outokumpu and Ilomantsi, eastern Finland, and the Abisko study area, northern Sweden. Reference system: WGS84.
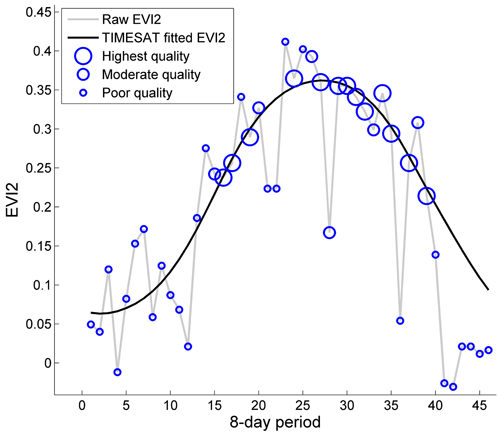
Fig. 2. MODIS derived 2-band Enhanced Vegetation Index (EVI2) (grey line) and EVI2 fitted in TIMESAT with a double logistic function (black line) for the year 2001 and one MODIS pixel in the Outokumpu area. Blue circles show the quality of the data, with large circles for high quality and small circles for low quality. Season max, the seasonality parameter used in this study, is the maximum vegetation index value of the TIMESAT fitted function.
| Table 1. Confusion matrix of terminology for a classification into damaged and healthy pixels. True Positive Rate (TPR) is the ratio of the damaged MODIS pixels that were classified as damaged, and False Positive Rate (FPR) is the ratio of the healthy pixels that were misclassified as damaged. | |||
| True condition | |||
| Damaged | Healthy | ||
| Result of classification | Damaged | True damaged (TPR) | False damaged (FPR) |
| Healthy | False healthy | True healthy | |
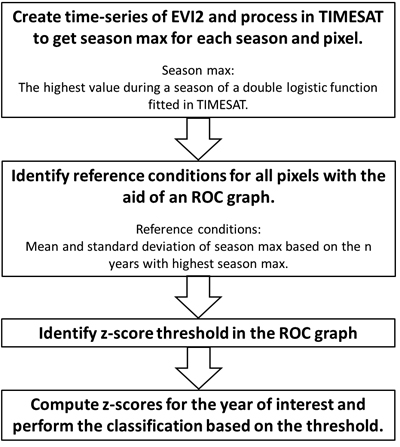
Fig. 3. Workflow of the developed defoliation detection method. The 2-band Enhanced Vegetation Index (EVI2) is derived from MODIS data with 250 m spatial and 8 days temporal resolution, and smoothed with double logistic functions in the TIMESAT software (Jönsson and Eklundh 2002, 2004). Receiver Operating Characteristics (ROC) graphs are used to visualize the ratio of the damaged MODIS pixels that were correctly classified and the ratio of healthy MODIS pixels that are misclassified as damaged. The number of years to base the reference condition on and the z-score threshold were decided based on the ROC graph.
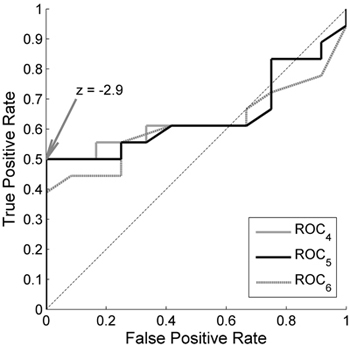
Fig. 4. Receiver Operating Characteristics (ROC) curves for the 2-band Enhanced Vegetation Index (EVI2) in Outokumpu. True Positive Rate is the ratio of the damaged MODIS pixels that were classified as damaged, and False Positive Rate is the ratio of the healthy pixels that were classified as damaged. A single curve is created by applying the developed method with the damage detection based on a range of different z-score thresholds. The different curves are created by basing the reference conditions on the 4 years (ROC4), 5 years (ROC5) and 6 years (ROC6) with highest season max values. z = –2.9 is the threshold that gives a result closest to the theoretically best classification at coordinate (0,1).
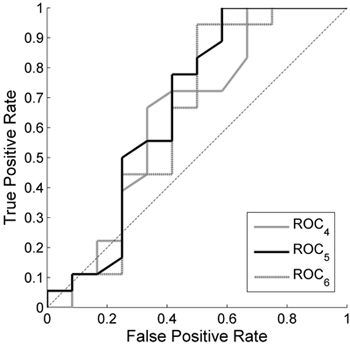
Fig. 5. Receiver Operating Characteristics (ROC) curves for the Normalized Difference Vegetation Index (NDVI) in Outokumpu. True Positive Rate is the ratio of the damaged MODIS pixels that were classified as damaged, and False Positive Rate is the ratio of the healthy pixels that were classified as damaged. A single curve is created by applying the developed method with the damage detection based on a range of different z-score thresholds. The different curves are created by basing the reference conditions on the 4 years (ROC4), 5 years (ROC5) and 6 years (ROC6) with highest season max values. z = –2.9 is the threshold that gives a result closest to the theoretically best classification at coordinate (0,1).
| Table 2. Results of the method evaluation for the Outokumpu and Ilomantsi areas. Thresholds are z-scores of the seasonal maximum of the 2-band Enhanced Vegetation Index (EVI2) fitted to a double logistic function in TIMESAT. The lower threshold is the threshold that gave a classification closest to the theoretically perfect classification, while the higher threshold is a threshold that resulted in 50% misclassification of healthy pixels in the training data. | ||||
| Outokumpu | Ilomantsi | |||
| Threshold (EVI2 z-score) | –2.9 | –2.1 | –2.9 | –2.1 |
| Detected defoliation | 50% | 63% | 27% | 46% |
| Misclassified healthy stands | 22% | 37% | 54% | 70% |
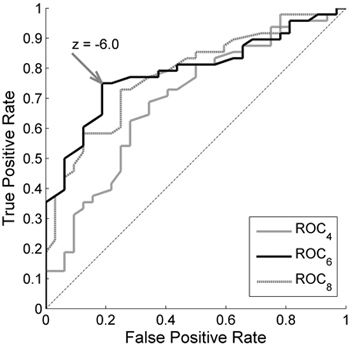
Fig. 6. Receiver Operating Characteristics (ROC) curves for the 2-band Enhanced Vegetation Index (EVI2) in Abisko. True Positive Rate is the ratio of the damaged MODIS pixels that were classified as damaged, and False Positive Rate is the ratio of the healthy pixels that were classified as damaged. A single curve is created by applying the developed method with the damage detection based on a range of different z-score thresholds. The different curves are created by basing the reference conditions on the 4 years (ROC4), 6 years (ROC6) and 8 years (ROC8) with highest season max values. z = –2.9 is the threshold that gives a result closest to the theoretically best classification at coordinate (0,1).