| Table 1. The geographical characteristics of four isolated populations of Betula pendula in Iran and the sample size (N) in each population. |
| Populations | N | Population area (Hectare) | Latitude (°N) | Longitude (°E) | Altitude (Meter Above sea level) |
| Syahmarzkouh | 6 | 5 | 36° 38´ | 55° 10´ | 2344 |
| Sangedeh | 5 | 100 | 36° 58´ | 53° 10´ | 2579 |
| Shahrestanak | 6 | 5 | 35° 44´ | 51° 23´ | 2404 |
| Marmisho | 5 | 1 | 37° 34´ | 44° 35´ | 1741 |
| Table 2. The PCR-RFLP chloroplast DNA haplotypes in four isolated populations of Betula pendula in Iran. |
| Haplotypes | CD-HinfI (NPB = 7) | K1K2-HinfI (NPB = 3) | K1K2-TaqI (NPB = 4) | K1K2-EcoRI (NPB = 3) | DT-HinfI (NPB = 2) | DT-TaqI (NPB = 2) | DT-EcoRI (NPB = 3) |
| A | 0000000 | 001 | 1001 | 111 | 11 | 11 | 011 |
| B | 0010000 | 001 | 1001 | 100 | 00 | 11 | 011 |
| C | 0011111 | 101 | 1001 | 111 | 01 | 01 | 011 |
| D | 0111111 | 001 | 1001 | 101 | 01 | 01 | 011 |
| E | 0111111 | 001 | 1111 | 101 | 01 | 11 | 011 |
| F | 0111111 | 001 | 1111 | 111 | 00 | 11 | 011 |
| G | 0111111 | 101 | 1001 | 111 | 11 | 11 | 011 |
| H | 1010000 | 001 | 1001 | 111 | 00 | 11 | 011 |
| I | 1010000 | 001 | 1001 | 111 | 00 | 11 | 111 |
| J | 1010000 | 011 | 1011 | 111 | 00 | 11 | 011 |
| K | 1110000 | 001 | 1001 | 111 | 00 | 11 | 011 |
| L | 1110000 | 101 | 1001 | 111 | 00 | 11 | 011 |
| M | 1111111 | 001 | 1001 | 100 | 11 | 01 | 111 |
| N | 1111111 | 001 | 1001 | 101 | 01 | 11 | 011 |
| O | 1111111 | 001 | 1001 | 111 | 01 | 11 | 011 |
| P | 1111111 | 001 | 1111 | 101 | 01 | 11 | 011 |
| Q | 1111111 | 011 | 1101 | 100 | 00 | 01 | 011 |
| R | 1111111 | 101 | 1001 | 101 | 11 | 01 | 011 |
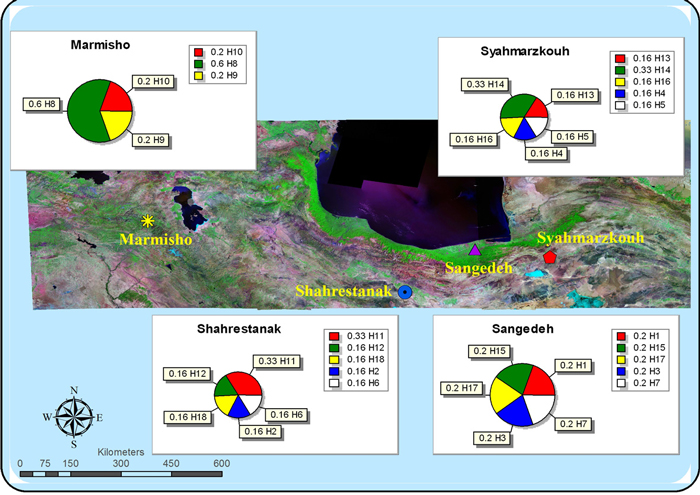
| Table 3. The location and distribution of PCR-RFLP chloroplast haplotypes over populations. The Haplotype frequency (Hf) and the total number of haplotypes (tN) found in each of the populations are also given. |
| Populations | Haplotypes | tN | Hf |
| | A | B | C | D | E | F | G | H | I | J | K | L | M | N | O | P | Q | R | | |
| Siahmarzkoh | 0 | 0 | 0 | 1 | 1 | 0 | 0 | 0 | 0 | 0 | 0 | 0 | 1 | 2 | 0 | 1 | 0 | 0 | 6 | 0.942 |
| Sangdeh | 1 | 0 | 1 | 0 | 0 | 0 | 1 | 0 | 0 | 0 | 0 | 0 | 0 | 0 | 1 | 0 | 1 | 0 | 5 | 0.946 |
| Shahrestanak | 0 | 1 | 0 | 0 | 0 | 1 | 0 | 0 | 0 | 0 | 2 | 1 | 0 | 0 | 0 | 0 | 0 | 1 | 6 | 0.942 |
| Marmishoo | 0 | 0 | 0 | 0 | 0 | 0 | 0 | 3 | 1 | 1 | 0 | 0 | 0 | 0 | 0 | 0 | 0 | 0 | 5 | 0.901 |
| (Hf)% | 20 | 16 | 20 | 16 | 16 | 16 | 20 | 60 | 20 | 20 | 33 | 16 | 16 | 33 | 20 | 16 | 20 | 16 | - | - |
| Table 4. Estimates of average gene diversity within four isolated populations of Betula pendula in Iran (HS), total gene diversity (HT), inter-population differentiation (GST), and the number of substitution types (NST), with permut, using a permutation test with 1000 permutations. |
| Populations | HS | HT | GST | NST |
| Syahmarzkouh | 0.776 | 0.942 | 0.197 | - |
| Sangedeh | 0.800 | 0.946 | 0.188 | - |
| Shahrestanak | 0.776 | 0.942 | 0.197 | - |
| Marmisho | 0.560 | 0.901 | 0.305 | - |
| Total | 0.729 | 0.932 | 0.218 | 0.281 |
| Table 5. Analyses of molecular variance (AMOVA) for four isolated populations of Betula pendula in Iran by PCR-RFLP: Statistics include sums of squared deviations (SSD); mean squared deviations (MSD), variance component estimates, the percentage of the total variance contributed by each component and the probability of obtaining a more extreme component estimate by chance alone. |
| Source | df | SSD | | MSD | Est. Var. | Pvar | | p-value |
| Among population | 3 | 31.997 | | 10.666 | 1.429 | 34% | | 0.010 |
| Within population | 18 | 50.867 | | 2.826 | 2.826 | 66% | | 0.010 |
| Total | 21 | 82.864 | | | 4.255 | 100% | | |
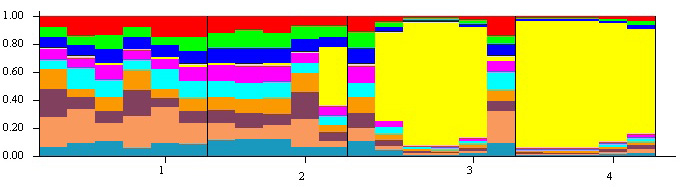
Fig. 2. The population structure of four isolated populations of Betula pendula in Iran estimated by STRUCTURE. In the figure, the individuals were categorized by population (1- Syahmarzkouh; 2- Sangedeh; 3- Shahrestanak; and 4- Marmisho).
| Table 6. The proportion of membership of each pre-defined population (Four isolated populations of Betula pendula in Iran) in each of the four clusters. |
| Cluster | 1 | 2 | 3 | 4 |
| 1 | 0.013 | 0.269 | 0.384 | 0.334 |
| 2 | 0.113 | 0.294 | 0.296 | 0.296 |
| 3 | 0.597 | 0.104 | 0.161 | 0.138 |
| 4 | 0.940 | 0.019 | 0.020 | 0.021 |
| AD | 0.0242 | 0.1741 | 0.1510 | 0.1618 |