| Table 1. The number of trials and genetic entries (N) used in both the model development (provenance and check-lot data) and for testing model performance (progeny data) parts of the study and their mean (minimum and maximum in parentheses) latitude (LAT), longitude (LONG), altitude (ALT) and temperature sum (TS). | |||||
| N | LAT (°N) | LONG (°E) | ALT (m a.s.l) | TS1 | |
| Provenance and check-lot data | |||||
| Finnish trials | 289 | 63.9 (60.2–69.4) | 27.0 (22.0–31.6) | 178 (5–300) | 1042 (577–1396) |
| Swedish trials | 89 | 64.0 (60.1–67.8) | 17.7 (12.4–23.2) | 346 (5–775) | 863 (618–1133) |
| Finnish entries | 163 | 65.3 (60.0–69.8) | 26.3 (17.8–31.3) | 170 (5–415) | 941 (539–1390) |
| Swedish entries | 113 | 64.2 (57.6–69.8) | 18.5 (12.8–28.6) | 291 (5–850) | 888 (528–1530) |
| Progeny data | |||||
| Finnish trials | 19 | 62.4 (60.7–66.5) | 26.3 (24.1–29.4) | 128 (71–282) | 1186 (756–1346) |
| Swedish trials | 100 | 64.5 (61.0–67.6) | 18.5 (12.4–23.3) | 313 (25–724) | 856 (618–1066) |
| Finnish entries | 690 | 62.0 (60.0–66.8) | 27.0 (21.6–30.9) | 122 (82–283) | 1220 (838–1341) |
| Swedish entries | 3231 | 65.2 (61.7–68.5) | 18.9 (13.0–23.8) | 314 (0–754) | 829 (452–1077) |
| 1 Long term average heat sum (degree days), threshold 5 °C. | |||||
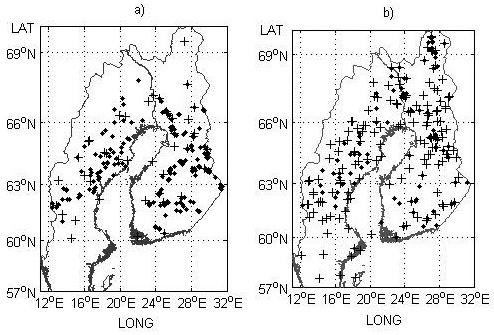
Fig. 1. Field trial sites a) and genetic entry origins b) used for the model development part of the study. Provenance trials and origins are indicated by black crosses and progeny trials and check-lots by black dots.
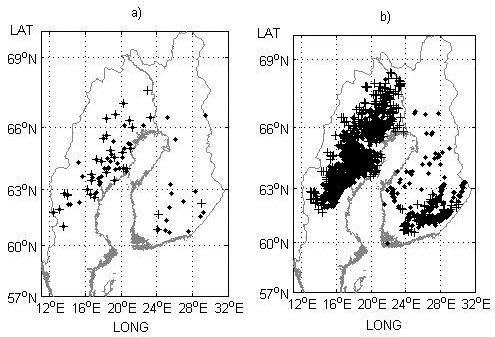
Fig. 2. Field trial sites a) and genetic entry origins b) used for model performance testing in the study. Progeny trials with half-sibs and their origins are indicated by black crosses and progeny trials with full-sibs and their origins (mid-parent values) by black dots.
| Table 2. The average number of genetic entries per trial, trials per genetic entry, trees analyzed and mean survival, height, establishment year, age of height assessment, and age of survival assessment used in both the model development (provenance and check-lot data) and for testing model performance (progeny data) parts of the study (maximum and minimum values in parentheses where applicable). View in new window/tab. |
| Table 3. A summary of the variables describing geographical location, site and climatic conditions for trial sites and genetic entry origins. | ||
| Variable | Time span1 | Description |
| LAT | - | Latitude (degrees, WGS84) |
| LONG | - | Longitude (degrees, WGS84) |
| ALT | - | Altitude (m a.s.l.) |
| TS | ANN | Long term average temperature sum during the growing season (degree days), threshold 5 °C. |
| Tmean | ANN, DJF, MAM, JJA, SON | Mean temperature (°C) |
| ContInd | ANN | Continentality index calculated as the difference between the average July mean temperature and January mean temperature. A lower value represents a maritime climate whereas a higher value represents a continental climate. |
| VegPer | ANN | Vegetation period length. The number of days between the start and end of the vegetation period. |
| VegStart | ANN | Vegetation period start. The first day of the year in the first continuous period where the mean temperature has been at least 5 °C for four consecutive days. |
| VegEnd | ANN | Vegetation period end. The last day of the year in the last continuous period where the mean temperature has been at least 5 °C for four consecutive days. |
| MaxDrySpell2 | ANN, AMJJ, ASO | Dry spell (days). The longest continuous period in which the precipitation is <1mm/day. |
| precipSum2 | ANN, AMJJASO | Precipitation (mm). |
| 1 Different time spans for the variable. ANN = Annual. DJF = December–February. MAM = March–May. JJA = June–August. SON = September–November. AMJJ = April–July. ASO = August–October. AMJJASO = April–October. 2 The drought and precipitation indices exhibited systematic differences between the countries (Bärring et al. 2016) and could therefore only be used for within country analyses. | ||
| Table 4. Coefficients and variance estimates with the natural logarithm of height as the dependent variable. Independent variables are the age of height assessment (ah), establishment year minus 1945 (EY-1945), temperature sum (TS) and transfer in latitude (ΔLAT). | |||
| Variable | Coefficient | Estimate | p-value |
| Intercept | μ | –6.0063 | <0.0001 |
| ln ah | α1 | 1.6279 | <0.0001 |
| ln (EY-1945) | α2 | 0.156 | <0.0001 |
| ln TS | α3 | 0.995 | <0.0001 |
| ΔLAT | β1 | 0.02907 | <0.0001 |
| ΔLAT2 | β2 | –0.01714 | <0.0001 |
| TS×ΔLAT | γ1 | –0.00005 | <0.0001 |
| TS×ΔLAT2 | γ2 | 0.000011 | <0.0001 |
| Variance between trials | 0.06237 | ||
| Variance within trials | 0.03336 | ||
| Total variance in dependent variable | 2.1907 | ||
| Table 5. Coefficients and variance estimates with the logit transformed survival projected to 2.5 m height as the dependent variable. Independent variables are temperature sum (TS), transfer in latitude (ΔLAT), altitude (ALT) and a dummy variable ( δ ) where 0 represents Sweden and 1 Finland. | |||
| Variable | Coefficient | Estimate | p-value |
| Intercept | μ | –86.3416 | <0.0001 |
| Country | δ | –0.9286 | <0.0001 |
| TS | α1 | –0.01082 | 0.0005 |
| ln TS | α2 | 14.2905 | <0.0001 |
| ΔLAT | β1 | 0.1626 | <0.0001 |
| ΔLAT2 | β2 | –0.05642 | <0.0001 |
| ALT×ΔLAT | γ1 | 0.000864 | <0.0001 |
| ALT×ΔLAT2 | γ2 | –0.00007 | 0.0011 |
| Variance between trials | 0.8134 | ||
| Variance within trials | 4.0489 | ||
| Total variance in dependent variable | 27.5474 | ||
| Table 6. The four representative sites chosen to illustrate the model performance. | ||||
| Site | LAT1 | TS2 | ALT3 | Description |
| 62M | 62 | 1200 | 100 | Milder coastal areas in central Sweden and milder areas in southern Finland. |
| 62H | 62 | 750 | 450 | Harsher high-altitude sites in central Sweden. |
| 66M | 66 | 1000 | 100 | Milder low-land and coastal areas in northern Sweden and Finland. |
| 66H | 66 | 650 | 350 | Harsher areas with higher altitudes in northern Sweden and Finland. |
| 1 Approximate latitude corresponding to the general site description and combination of TS and ALT. 2 Long term average heat sum (day degrees), threshold 5 °C. 3 Altitude (m a.s.l.) | ||||
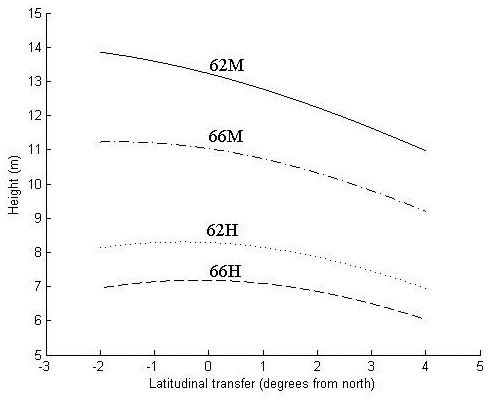
Fig. 3. Height in meters at age 30 years as a function of latitudinal transfer from four representative sites. Two sites are at latitude 62°N, where one is considered mild (62M) and one harsh (62H), and two at latitude 66°N, where one is considered mild (66M) and one harsh (66H). For detailed descriptions of the sites see Table 6.
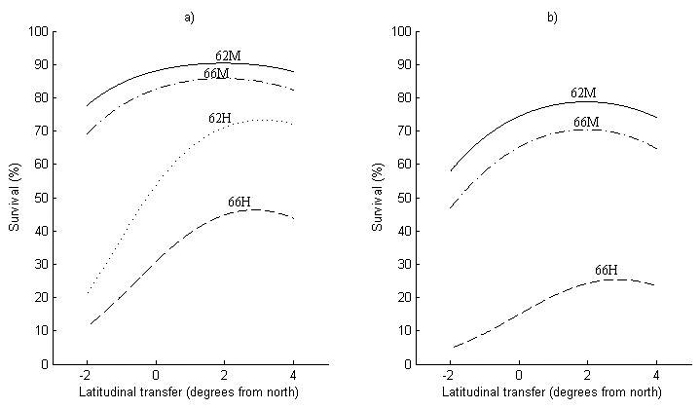
Fig. 4. Survival at 2.5 meters height for (a) Sweden and (b) Finland as a function of latitudinal transfer from four representative sites. Two sites are at latitude 62°N, where one is considered mild (62M) and one harsh (62H), and two at latitude 66°N, where one is considered mild (66M) and one harsh (66H). Note that (62H) represents a site type that does not occur in Finland and is therefore not shown in (b). For detailed descriptions of the sites see Table 6.
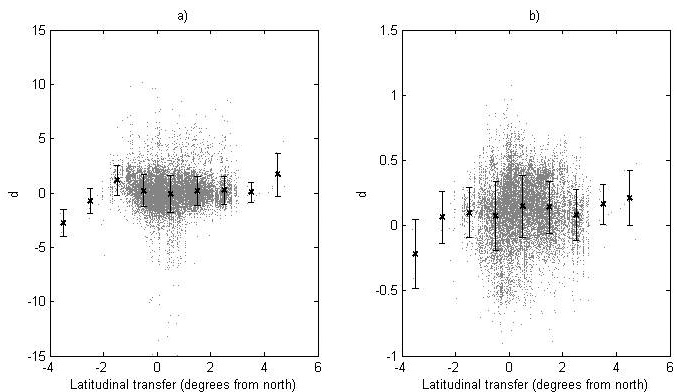
Fig. 5. The deviation, d, between the recorded value and the predicted value of (a) the logit transformed survival and (b) the ln-transformed height for the genetic entries in the progeny data. For each latitude class the mean value (black cross) and standard deviation (bars) are given.