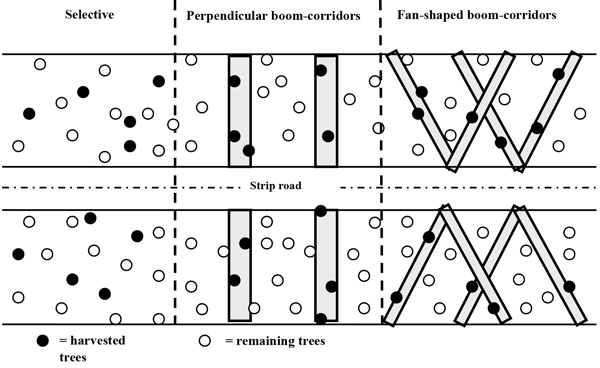
Fig 1. Sketch of possible selective thinning and two boom-corridor thinning patterns between strip roads, as described in Bergström (2009).
| Table 1. BCT 1-series. The average values of various stand structure parameters from three sites in Southern Sweden with mean and dominating heights of ca 6 and 11 m, respectively. Values are shown before and after five thinning alternatives, including a control with no thinning. The other four treatments are conventional thinning, boom corridor thinning with corridor width of 1 m and length of 10 m (BCT1 m), boom corridor thinning with corridor width of 2 m and length of 10 m (BCT2 m), and selective boom corridor thinning with corridor width of 1 m and a length of 10 m (BCTsel). Values with significant differences at the 0.05 probability level based on Tukey’s multiple comparison test are marked with different letters. Dg is the basal area weighted diameter at breast height (1.3 m). Diam. Nsel demonstrates the average DBH for each plot calculated from the same number of stems as were left in the conventional thinning plot. The removal of deciduous trees was calculated based on the amount of deciduous trees in the plot before treatment. View in new window/tab. |
| Table 2. BCT 2-series. The average values of various stand structure parameters from two sets of stands from sites in Northern, Central and Southern Sweden, with mean and dominating heights of 4 and 9 m or 5 and 10 m. The values are shown before and after different thinning operations. Stands with a dominating height of 9 m were subject to either selective boom corridor thinning with a corridor width of 1 m and a length of 10 m (BCT) or pre-commercial thinning (PCT). In contrast, stands with a dominating height of 10 m were subject to conventional selective thinning, boom-corridor thinning that targeted smaller-diameter trees (BCTlow), or boom-corridor thinning that targeted larger-diameter trees (BCThigh). Values with significant differences at the 0.05 probability level based on Tukey’s multiple comparison test are marked with different letters row-wise. Dg is basal area weighted diameter at breast height (1.3 m). Nsel demonstrates the average DBH for each plot calculated from the same number of stems as were left in the conventional thinning plot. The removal of deciduous trees was calculated based on the amount of deciduous trees in the plot before treatment. View in new window/tab. |
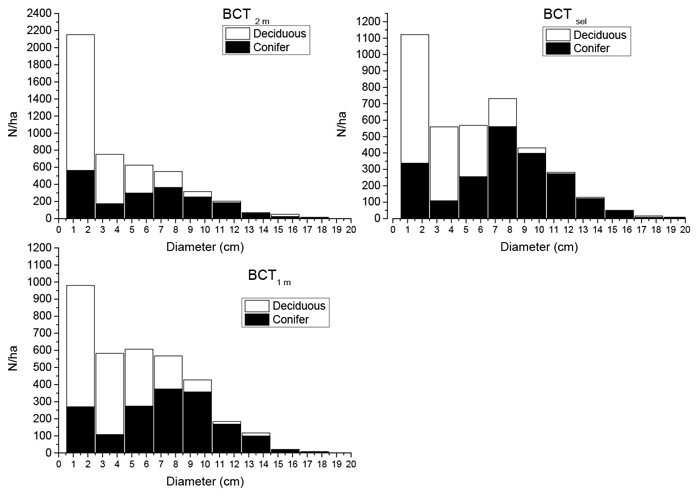
Fig. 2a. Number of stems ha–1 for conifer and deciduous species for diameter classes 0–20 cm, mean values for all sites. BCT 1-serie, mean and dominant tree height 6 and 11 m; treatment BCT2 m, BCT1 m and BCTsel.
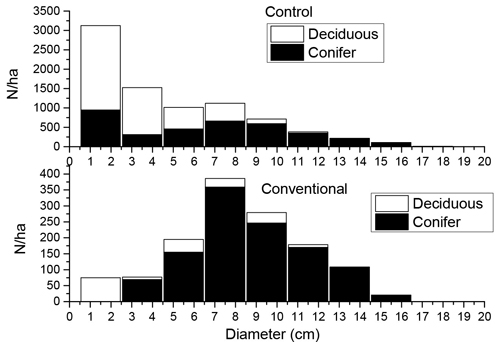
Fig. 2b. Number of stems ha–1 for conifer and deciduous species for diameter classes 0–20 cm, mean values for all sites. BCT 1-serie, mean and dominant tree height 6 and 11 m; control and conventional treatments.
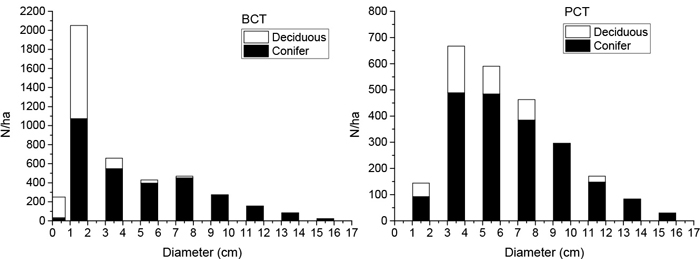
Fig. 2c. Number of stems ha–1 for conifer and deciduous species for diameter classes 0–17 cm, mean values for all sites. BCT 2-series, mean and dominant tree height 4 and 9 m, treatment BCT and PCT.
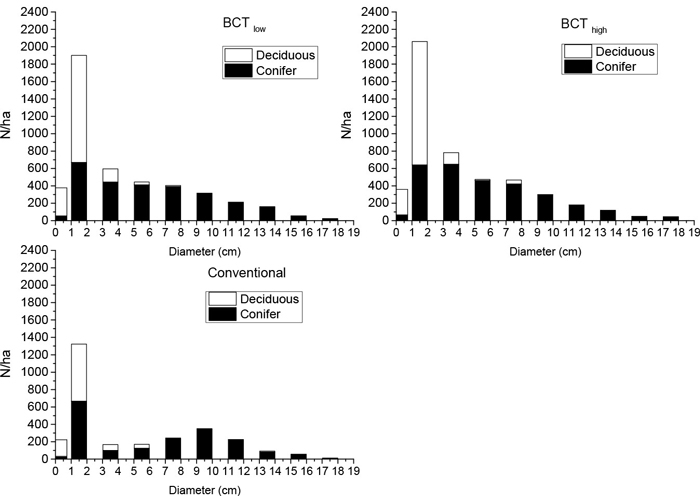
Fig. 2d. Number of stems ha–1 for conifer and deciduous species for diameter classes 0–19 cm, mean values for all sites. BCT 2-series, mean and dominant tree height 5 and 10 m treatments BCTlow, BCThigh and conventional.