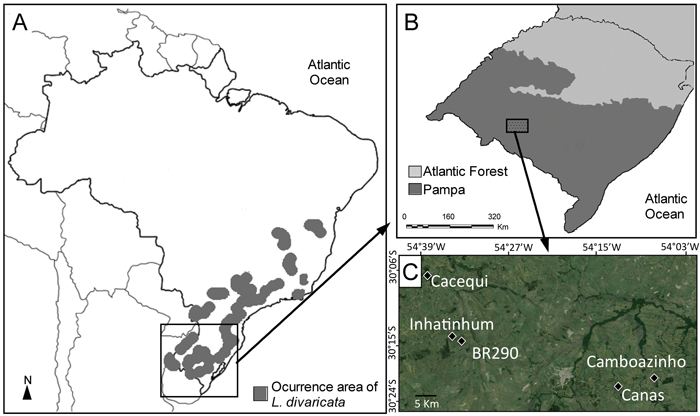
Fig. 1. (A) Distribution area of L. divaricata in Southern America, including Brazil and small border areas in Argentina, Uruguay and Paraguay (adapted from Carvalho 2001). (B) Location of the Pampa biome in southern Brazil. (C) Location of the five studied populations within the Pampa biome.
| Table 1. Heterozygosity excess, mode-shift distribution and M-ratio analyses of bottleneck signature for populations of L. divaricata, based on five microsatellite loci. Values in bold means positive signature of a genetic bottleneck event. | |||||||||
| Population | Genetic diversity parameters | Loci with heterozygosity excess | Mode-shift distribution | M-ratio analysis | |||||
| k | HE | TPM | SMM | M-value | Ne = 500 | Ne = 100 | Ne = 50 | ||
| Camboazinho | 4.4 | 0.69 | 5 (p = 0.02) | 5 (p = 0.02) | L-shaped | 0.61 | p = 0.030 | p = 0.009 | p = 0.007 |
| Canas | 7.0 | 0.77 | 5 (p = 0.02) | 4 (p = 0.11) | L-shaped | 0.64 | p = 0.047 | p = 0.015 | p = 0.012 |
| Inhatinhum | 4.8 | 0.61 | 4 (p = 0.31) | 3 (p = 0.41) | L-shaped | 0.63 | p = 0.045 | p = 0.015 | p = 0.009 |
| Cacequi | 3.8 | 0.53 | 4 (p = 0.11) | 2 (p = 0.68) | L-shaped | 0.46 | p = 0.006 | p = 0.001 | p = 0.002 |
| BR290 | 4.4 | 0.61 | 4 (p = 0.03) | 4 (p = 0.31) | Shifted | 0.51 | p = 0.026 | p = 0.006 | p = 0.002 |
| K: number of alleles; HE: Hardy-Weinberg heterozygosity; TPM: two-phased mutation model; SMM: Stepwise mutation model; M-value: ratio of the total number of alleles to the overall range in allele size; Ne: effective population size | |||||||||
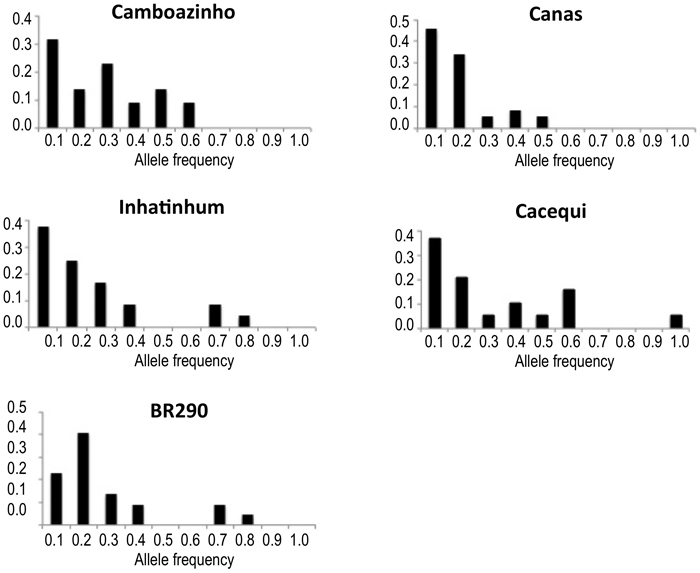
Fig. 2. Plotting of the frequency distribution of allele classes for microsatellite markers. Populations Camboazinho, Canas, Inhatinhum and Cacequi revealed a non-shifted alleles distribution, meaning absence of bottleneck signatures. Population BR290 revealed a shifted distribution, indicating historical reduction of the effective population size.
| Table 2. Linkage disequilibrium analysis of five microsatellite loci in populations of L. divaricata. Values in bold means positive signature of a genetic bottleneck event. | |||
| Pop | Pair of loci | p-value | |
| Camboazinho | Ldiv31 | Ldiv40 | 1.000 |
| Ldiv31 | Ldiv48 | 0.724 | |
| Ldiv40 | Ldiv48 | 0.048 | |
| Ldiv31 | Ldiv55 | 0.684 | |
| Ldiv40 | Ldiv55 | <0.001 | |
| Ldiv48 | Ldiv55 | 0.032 | |
| Ldiv31 | Ldiv58 | 0.314 | |
| Ldiv40 | Ldiv58 | 0.043 | |
| Ldiv48 | Ldiv58 | 0.116 | |
| Ldiv55 | Ldiv58 | 0.001 | |
| Canas | Ldiv31 | Ldiv40 | 0.049 |
| Ldiv31 | Ldiv48 | 0.085 | |
| Ldiv40 | Ldiv48 | 0.302 | |
| Ldiv31 | Ldiv55 | 0.001 | |
| Ldiv40 | Ldiv55 | 0.001 | |
| Ldiv48 | Ldiv55 | <0.001 | |
| Ldiv31 | Ldiv58 | 0.479 | |
| Ldiv40 | Ldiv58 | 0.018 | |
| Ldiv48 | Ldiv58 | 0.001 | |
| Ldiv55 | Ldiv58 | 0.003 | |
| Inhatinhum | Ldiv31 | Ldiv40 | 0.372 |
| Ldiv31 | Ldiv48 | 0.639 | |
| Ldiv40 | Ldiv48 | 0.265 | |
| Ldiv31 | Ldiv55 | 0.381 | |
| Ldiv40 | Ldiv55 | 0.350 | |
| Ldiv48 | Ldiv55 | 0.065 | |
| Ldiv31 | Ldiv58 | 0.850 | |
| Ldiv40 | Ldiv58 | 0.003 | |
| Ldiv48 | Ldiv58 | 0.919 | |
| Ldiv55 | Ldiv58 | 0.105 | |
| Cacequi | Ldiv31 | Ldiv40 | 0.746 |
| Ldiv31 | Ldiv48 | 0.236 | |
| Ldiv40 | Ldiv48 | 0.354 | |
| Ldiv31 | Ldiv55 | 0.161 | |
| Ldiv40 | Ldiv55 | 0.482 | |
| Ldiv48 | Ldiv55 | 1.000 | |
| Ldiv31 | Ldiv58 | 0.789 | |
| Ldiv40 | Ldiv58 | 0.239 | |
| Ldiv48 | Ldiv58 | 0.753 | |
| Ldiv55 | Ldiv58 | 0.966 | |
| BR290 | Ldiv31 | Ldiv40 | <0.001 |
| Ldiv31 | Ldiv48 | 0.407 | |
| Ldiv40 | Ldiv48 | 0.586 | |
| Ldiv31 | Ldiv55 | 0.724 | |
| Ldiv40 | Ldiv55 | 0.097 | |
| Ldiv48 | Ldiv55 | 0.460 | |
| Ldiv31 | Ldiv58 | 0.190 | |
| Ldiv40 | Ldiv58 | 0.143 | |
| Ldiv48 | Ldiv58 | 0.248 | |
| Ldiv55 | Ldiv58 | 0.428 | |
| Table 3. Mean seeds’ germinability (%), speed of germination (mean ± SD), proportion of anomalous germinated seeds (%), inbreeding coefficient (f), and observed heterozygosity (HO) of L. divaricata in four populations within the Brazilian Pampa biome. Values of the germination traits are the mean for six mother-trees and 25 seeds/tree. The correlation (r) between each germination trait and the inbreeding coefficient and observed heterozygosity was estimated using the Pearson’s product-moment correlation coefficient. | |||||
| Population | Mean seeds’ germinability | Speed of germination | Anomalous germinated seeds | f a | HOa |
| Camboazinho | 40.67 | 8.81 ± 4.21 | 3.33 | 0.213 | 0.52 |
| Canas | 19.33 | 4.19 ± 4.75 | 6.67 | 0.221 | 0.57 |
| Inhatinhum | 18.00 | 6.96 ± 8.50 | 7.33 | 0.236 | 0.42 |
| Cacequi | 32.67 | 13.03 ± 3.67 | 4.67 | –0.017 | 0.54 |
| r (f) | –0.36 | –0.86 | 0.36 | ||
| r (HO) | 0.31 | 0.03 | –0.39 | ||
| a Data from Nagel et al. (2015) | |||||