| Table 1. General characteristics of the study stands. Volumes of trees are calculated from the harvester data. |
| No | Area
ha | Site type | Volumes | Latitude | Longitude | Municipality |
| Pine m3/ha | Spruce m3/ha | Birch m3/ha | Total m3/ha |
| 1 | 1.7 | VT | 194 | 3.2 | 2.9 | 200 | 61.2149 | 25.0953 | Hämeenlinna |
| 2 | 1.1 | VT | 206 | 5.8 | 4.5 | 216 | 61.2061 | 25.0981 | Hämeenlinna |
| 3 | 1.6 | OMT | 188 | 30 | 18 | 236 | 61.1976 | 25.1361 | Hämeenlinna |
| 4 | 0.7 | MT | 268 | 388 | 30 | 686 | 61.1822 | 25.1523 | Hämeenlinna |
| 5 | 1.6 | MT/VT | 142 | 104 | 40 | 286 | 61.2043 | 25.0651 | Hämeenlinna |
| 6 | 0.7 | MT | 218 | 359 | 9.5 | 586 | 60.9049 | 25.6822 | Orimattila |
| 7 | 2.0 | VT | 106 | 47 | 19 | 172 | 60.7142 | 25.8791 | Myrskylä |
| Table 2. The average ground-truth stand characteristics calculated from harvester data (Cut trees). |
| Cut trees | N, ha–1 | G, m2ha–1 | DG, cm | HG, m | V, m3ha–1 | Log, m3ha–1 | Pulp, m3ha–1 |
| pine | 240.2 | 17 | 31.9 | 26.4 | 188.8 | 149.8 | 38.4 |
| spruce | 249.8 | 11.3 | 27 | 22.1 | 133.7 | 113.6 | 18.8 |
| broadleaves | 57.2 | 1.8 | 25.5 | 21.4 | 17.7 | 6.2 | 11.3 |
| Total | 547.3 | 30.1 | 30.3 | 25.3 | 340.4 | 269.7 | 68.5 |
| Table 3. The descriptive statistics of 8763 trees from 364 sample plots of 16 × 16 m used for ABA modelling around the Hämeenlinna test site (e.g. Yu et al. 2015). |
| | minimum | maximum | mean | Standard deviation |
| N, ha–1 | 195 | 3242 | 940 | 596 |
| G, m2ha–1 | 3.7 | 57.3 | 26.8 | 9.2 |
| DG, cm | 10.4 | 53.0 | 25.7 | 7.9 |
| HG, m | 7.6 | 33.2 | 21.0 | 4.5 |
| V, m3ha–1 | 21.3 | 786.1 | 270.1 | 123.8 |
| Tree dbh, cm | 5.0 | 71.9 | 16.6 | 9.4 |
| Table 4. Absolute and relative bias in stand characteristics by the optional methods. The best methods by tree species and stand totals are highlighted in bold and the worst are shown in italics. |
| | N,ha–1 | G, m2ha–1 | DG, cm | HG, m | Bias% | N, % | G, % | DG, % | HG, % |
| ABA grid |
| pine | –51.62 | –1.64 | –1.68 | 1.97 | | –21.5 | –9.6 | –5.3 | 7.5 |
| spruce | 28.51 | 4.12 | 4.82 | 3.32 | | 11.4 | 36.4 | 17.8 | 15.0 |
| broadleaves | –43.94 | 0.01 | 5.65 | 1.94 | | –76.8 | 0.8 | 22.2 | 9.1 |
| Total | –67.05 | 2.49 | 0.64 | 2.03 | | –12.3 | 8.3 | 2.1 | 8.0 |
| ABA stand |
| pine | –52.97 | –1.61 | –1.19 | 2.46 | | –22.1 | –9.5 | –3.7 | 9.3 |
| spruce | –50.80 | 3.91 | 9.93 | 7.05 | | –20.3 | 34.5 | 36.7 | 31.9 |
| broadleaves | –77.17 | –0.50 | 8.18 | 3.49 | | –134.9 | –27.9 | 32.1 | 16.4 |
| Total | –180.94 | 1.80 | 3.02 | 3.27 | | –33.1 | 6.0 | 10.0 | 12.9 |
| Trestima 5 |
| pine | –25.27 | 0.79 | 0.37 | 2.76 | | –10.5 | 4.6 | 1.2 | 10.4 |
| spruce | 29.74 | 1.53 | 8.71 | 8.28 | | 11.9 | 13.6 | 32.2 | 37.5 |
| broadleaves | –45.41 | –0.23 | 9.22 | 9.38 | | –79.4 | –13.0 | 36.2 | 43.9 |
| Total | –40.95 | 2.10 | 1.43 | 3.07 | | –7.5 | 7.0 | 4.7 | 12.1 |
| Trestima 10 |
| pine | –35.60 | 0.25 | 0.34 | 4.04 | | –14.8 | 1.5 | 1.1 | 15.3 |
| spruce | 40.95 | 2.17 | 4.48 | 4.73 | | 16.4 | 19.1 | 16.6 | 21.4 |
| broadleaves | 4.78 | 0.29 | 10.52 | 8.33 | | 8.4 | 16.5 | 41.3 | 39.0 |
| Total | 10.13 | 2.71 | 0.84 | 3.16 | | 1.9 | 9.0 | 2.8 | 12.5 |
| EMO |
| pine | 44.37 | 0.86 | –1.80 | 1.83 | | 18.5 | 5.1 | –5.6 | 6.9 |
| spruce | 160.09 | 6.03 | 6.64 | 7.92 | | 64.1 | 53.3 | 24.6 | 35.9 |
| broadleaves | 46.66 | 1.17 | 7.41 | 9.25 | | 81.5 | 65.7 | 29.1 | 43.3 |
| Total | 251.12 | 8.06 | –2.60 | 1.50 | | 45.9 | 26.8 | –8.6 | 5.9 |
| Table 5. Absolute and relative RMSE in stand characteristics by methods. The best methods by tree species and stand totals are highlighted in bold and the worst are shown in italics. |
| | N, ha–1 | G, m2ha–1 | DG, cm | HG, m | RMSE% | N, % | G, % | DG, % | HG, % |
| ABA grid |
| pine | 145.6 | 7.5 | 7.1 | 2.5 | | 60.6 | 44.0 | 22.4 | 9.6 |
| spruce | 182.1 | 10.9 | 6.2 | 4.4 | | 72.9 | 96.4 | 23.0 | 19.9 |
| broadleaves | 73.5 | 1.3 | 10.4 | 6.5 | | 128.5 | 70.3 | 40.8 | 30.4 |
| Total | 193.5 | 7.8 | 3.2 | 2.3 | | 35.4 | 26.0 | 10.6 | 9.3 |
| ABA stand |
| pine | 150.0 | 7.9 | 6.6 | 3.5 | | 62.5 | 46.3 | 20.7 | 13.2 |
| spruce | 204.8 | 10.6 | 11.7 | 8.7 | | 82.0 | 94.0 | 43.2 | 39.4 |
| broadleaves | 105.1 | 1.5 | 11.6 | 8.9 | | 183.7 | 83.7 | 45.7 | 41.9 |
| Total | 315.6 | 7.6 | 5.0 | 4.6 | | 57.7 | 25.1 | 16.4 | 18.3 |
| Trestima 5 |
| pine | 129.1 | 6.6 | 4.6 | 4.2 | | 53.7 | 38.7 | 14.6 | 15.9 |
| spruce | 93.8 | 5.7 | 15.6 | 12.4 | | 37.5 | 50.6 | 57.6 | 56.4 |
| broadleaves | 156.2 | 1.9 | 17.0 | 14.2 | | 273.0 | 108.0 | 66.8 | 66.4 |
| Total | 240.3 | 9.3 | 4.0 | 4.2 | | 43.9 | 30.9 | 13.2 | 16.5 |
| Trestima 10 |
| pine | 128.7 | 5.4 | 2.6 | 4.7 | | 53.6 | 31.5 | 8.2 | 17.6 |
| spruce | 81.5 | 4.7 | 10.8 | 8.2 | | 32.6 | 41.7 | 39.9 | 37.2 |
| broadleaves | 52.7 | 1.2 | 15.9 | 12.4 | | 92.2 | 67.2 | 62.6 | 57.9 |
| Total | 187.0 | 9.4 | 2.5 | 3.7 | | 34.2 | 31.3 | 8.2 | 14.6 |
| EMO |
| pine | 60.7 | 2.7 | 2.6 | 2.2 | | 25.3 | 16.2 | 8.0 | 8.3 |
| spruce | 230.8 | 10.1 | 15.7 | 12.3 | | 92.4 | 88.9 | 58.1 | 55.6 |
| broadleaves | 57.0 | 1.7 | 18.7 | 14.9 | | 99.6 | 96.2 | 73.5 | 69.9 |
| Total | 317.4 | 12.1 | 3.4 | 1.9 | | 58.0 | 40.3 | 11.1 | 7.6 |
| Table 6. Absolute and relative bias in volume characteristics by methods. The best methods by tree species and stand totals are highlighted in bold and the worst are shown in italics. |
| | Volume, m3ha–1 | Logs, m3ha–1 | Pulp, m3ha–1 | Bias% | Volume | Logs | Pulp |
| ABA grid |
| pine | –10.33 | –1.62 | –9.01 | | –5.5 | –1.1 | –22.2 |
| spruce | 54.83 | 51.98 | 3.56 | | 41.0 | 45.7 | 15.8 |
| broadleaves | 1.58 | 1.49 | 0.17 | | 8.9 | 23.9 | 2.4 |
| Total | 46.13 | 51.87 | –5.26 | | 13.6 | 19.2 | –7.7 |
| ABA stand |
| pine | –5.09 | 3.23 | –8.15 | | –2.7 | 2.2 | –21.3 |
| spruce | 60.11 | 63.64 | –2.74 | | 44.9 | 56.0 | –14.5 |
| broadleaves | 0.29 | 1.94 | –1.35 | | 1.7 | 31.2 | –11.9 |
| Total | 55.36 | 68.85 | –12.22 | | 16.3 | 25.5 | –17.8 |
| Trestima 5 |
| pine | 23.10 | 21.87 | –1.70 | | 12.2 | 14.6 | –4.4 |
| spruce | 38.48 | 35.51 | 1.35 | | 28.7 | 31.2 | 7.2 |
| broadleaves | 1.59 | 0.30 | 2.26 | | 9.0 | 4.7 | 20.0 |
| Total | 59.66 | 57.70 | 1.94 | | 17.5 | 21.4 | 2.8 |
| Trestima10 |
| pine | 19.86 | 21.82 | –1.82 | | 10.5 | 14.6 | –4.8 |
| spruce | 30.32 | 28.29 | 1.84 | | 22.7 | 24.9 | 9.7 |
| broadleaves | 7.00 | 2.78 | 4.21 | | 39.6 | 44.6 | 37.2 |
| Total | 57.22 | 52.91 | 4.24 | | 16.8 | 19.6 | 6.2 |
| EMO |
| pine | 14.42 | 8.73 | 5.53 | | 7.6 | 5.8 | 14.4 |
| spruce | 80.34 | 67.70 | 11.69 | | 60.0 | 59.6 | 62.1 |
| broadleaves | 12.21 | 3.33 | 8.76 | | 69.0 | 53.4 | 77.4 |
| Total | 107.01 | 79.78 | 26.00 | | 31.4 | 29.6 | 37.9 |
| Table 7. Absolute and relative RMSE in volume characteristics by methods. The best methods by tree species or stand totals are highlighted in bold and the worst are shown in italics. |
| | Volume, m3ha–1 | Logs, m3ha–1 | Pulp, m3ha–1 | RMSE% | Volume | Logs | Pulp |
| ABA grid |
| pine | 77.7 | 60.0 | 20.3 | | 41.1 | 40.1 | 52.8 |
| spruce | 140.0 | 125.5 | 14.4 | | 104.6 | 110.4 | 76.3 |
| broadleaves | 14.1 | 6.6 | 7.8 | | 80.0 | 105.6 | 69.4 |
| Total | 111.3 | 106.1 | 11.9 | | 32.7 | 39.3 | 17.3 |
| ABA stand |
| pine | 77.3 | 60.4 | 20.5 | | 40.9 | 40.3 | 53.5 |
| spruce | 141.7 | 130.4 | 15.9 | | 105.9 | 114.8 | 84.4 |
| broadleaves | 14.2 | 7.3 | 7.6 | | 80.2 | 117.0 | 67.0 |
| Total | 115.2 | 111.6 | 20.7 | | 33.8 | 41.4 | 30.3 |
| Trestima 5 |
| pine | 79.0 | 66.0 | 20.8 | | 41.9 | 44.0 | 54.3 |
| spruce | 85.1 | 79.9 | 7.6 | | 63.6 | 70.3 | 40.5 |
| broadleaves | 14.9 | 7.5 | 10.2 | | 84.1 | 120.7 | 89.8 |
| Total | 146.9 | 126.9 | 26.9 | | 43.2 | 47.1 | 39.3 |
| Trestima10 |
| pine | 65.3 | 51.8 | 18.9 | | 34.6 | 34.5 | 49.3 |
| spruce | 67.1 | 61.6 | 6.7 | | 50.1 | 54.2 | 35.4 |
| broadleaves | 12.9 | 4.4 | 8.7 | | 73.0 | 71.1 | 77.3 |
| Total | 129.2 | 109.6 | 25.0 | | 38.0 | 40.6 | 36.5 |
| EMO |
| pine | 34.4 | 27.0 | 8.2 | | 18.2 | 18.0 | 21.3 |
| spruce | 138.3 | 119.6 | 17.8 | | 103.3 | 105.2 | 94.7 |
| broadleaves | 18.5 | 6.7 | 12.0 | | 104.4 | 108.2 | 106.4 |
| Total | 166.0 | 133.2 | 33.4 | | 48.8 | 49.4 | 48.8 |
| Table 8. Goodness of fit tests using Kolmogorov-Smirnov (KS-quotient, Tham 1998) and Error-Index (Reynolds et al. 1988). The smaller the value, the better the fit is. KS-quotient < 1 means passed case. The best test values by stands are highlighted in bold and the worst in italics. |
| Stand | | ABA grid | ABA stand | Trestima 5 | Trestima 10 | EMO |
| 1 | KS-quotient | 1.541 | 1.341 | 1.229 | 1.070 | 0.695 |
| Error-Index | 0.575 | 0.767 | 0.616 | 0.536 | 0.553 |
| 2 | KS-quotient | 0.744 | 1.021 | 2.242 | 1.226 | 0.384 |
| Error-Index | 0.494 | 0.809 | 0.783 | 0.646 | 0.393 |
| 3 | KS-quotient | 1.629 | 1.340 | 1.774 | 0.833 | 0.424 |
| Error-Index | 0.467 | 0.622 | 0.783 | 0.499 | 0.570 |
| 4 | KS-quotient | 0.577 | 0.796 | 1.132 | 0.558 | 0.678 |
| Error-Index | 0.609 | 0.505 | 0.618 | 0.313 | 0.446 |
| 5 | KS-quotient | 0.859 | 1.182 | 1.258 | 0.618 | 0.599 |
| Error-Index | 0.486 | 0.669 | 0.745 | 0.443 | 0.394 |
| 6 | KS-quotient | 0.574 | 0.793 | 0.608 | 0.566 | 0.591 |
| Error-Index | 0.477 | 0.499 | 0.419 | 0.328 | 0.624 |
| 7 | KS-quotient | 0.829 | 1.005 | 1.028 | 0.973 | 1.045 |
| Error-Index | 0.372 | 0.514 | 0.803 | 0.567 | 0.992 |
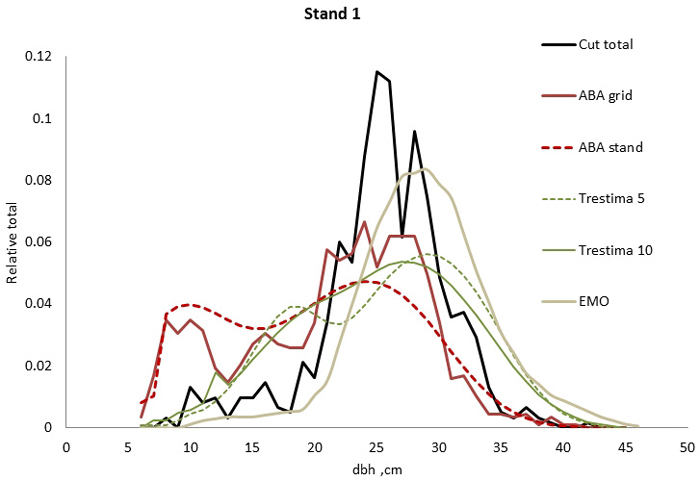
Fig. 1. Example of the breast height diameter (dbh) distributions for stand no. 1. EMO provided the best fit for total dbh distribution (all species together) according to Kolmogorov-Smirnov (KS) and Trestima 10 according to Error-Index (EI) goodness-of-fit tests.
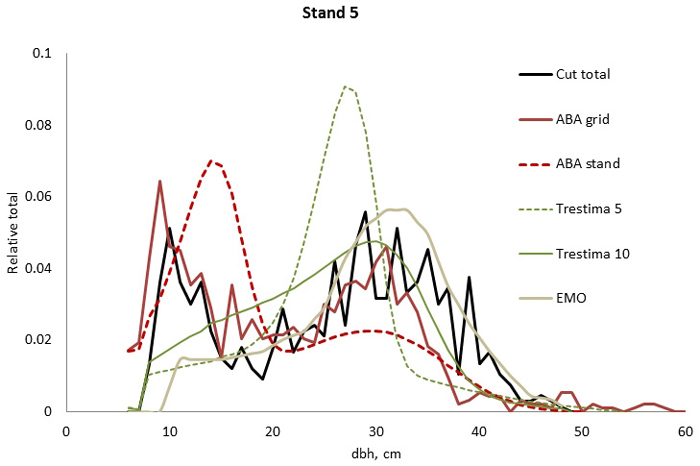
Fig. 2. Example of the breast height diameter (dbh) distributions for stand no. 5. ABA grid, Trestima 10 and EMO methods passed the Kolmogorov-Smirnov goodness-of-fit test while EMO had the best test values. Trestima 5 resulted in a too peaked dbh distribution.
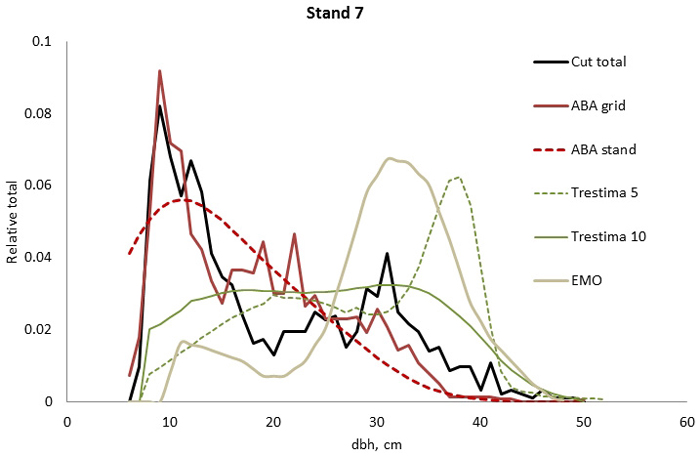
Fig. 3. Example of the breast height diameter (dbh) distributions for stand no. 7. ABA stand and ABA grid methods performed the best and second best according to Kolmogorov-Smirnov (KS) but according to Error-Index (EI), the ABA grid was slightly better. Trestima 5 and EMO did not pass the KS test and they provided the highest EI values.
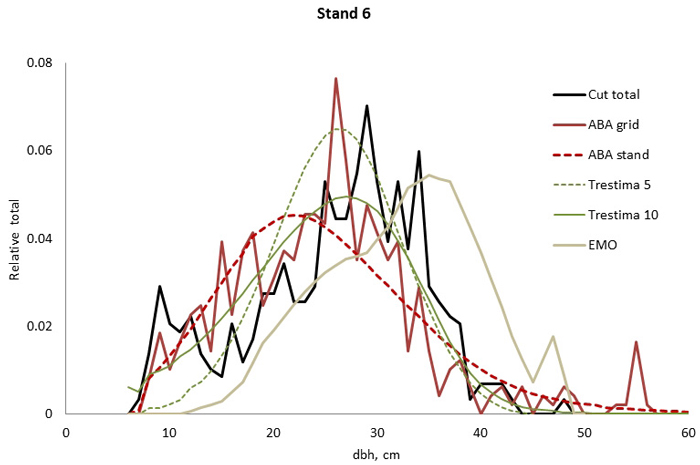
Fig. 4. Example of the breast height diameter (dbh) distributions for stand no. 6. Trestima 10 fitted the best according to Kolmogorov-Smirnov (KS) and Error-Index (EI) goodness-of-fit tests. The second best EI and KS test values were found using Trestima 5 and EMO, respectively. All the predicted dbh distributions passed the KS test.
| Table 9. Ranking the methods by the number of the best and the number of the worst cases among analysed criteria: Bias and RMSE for number of stems, basal area, basal area-weighted mean diameter, Lorey’s height, total volume, log and pulp wood volume by tree species and stand totals, as well as Kolmogorov-Smirnov (KS) and Error-Index (EI) tests. (Total of 70 criterion). The best performed method by each criteria is highlighted in bold. |
| Rank | Best | Worst |
| Criteria | ABA grid | ABA stand | Trestima 5 | Trestima 10 | EMO | ABA grid | ABA stand | Trestima 5 | Trestima 10 | EMO |
| Bias | 9 | 3 | 7 | 7 | 2 | 2 | 4 | 4 | 2 | 15 |
| RMSE | 8 | 1 | 0 | 11 | 8 | 2 | 5 | 8 | 1 | 12 |
| KS | 1 | 0 | 0 | 2 | 4 | 1 | 1 | 5 | 0 | 0 |
| EI | 2 | 0 | 0 | 3 | 2 | 0 | 2 | 3 | 0 | 2 |
| Total | 20 | 4 | 7 | 23 | 16 | 5 | 12 | 20 | 3 | 30 |