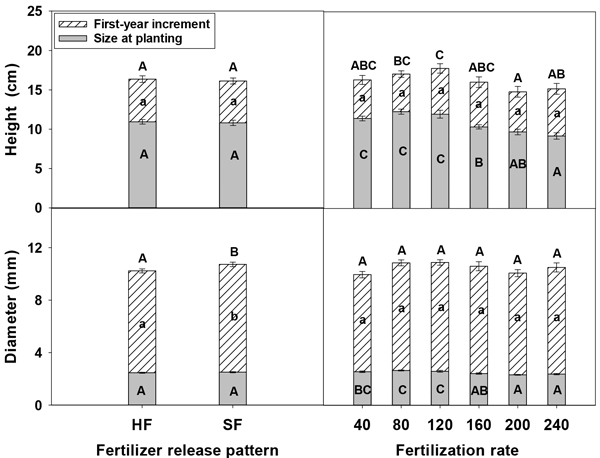
Fig. 1. Main effects of nursery fertilizer release pattern (HF = Hi·End fertilizer; SF = Standard fertilizer) and fertilization rate (mg N seedling–1) on Pinus tabulaeformis seedling total height, diameter, and their increments (means ± SE) at the time of field planting and at the end of the first-year outplanting season. Error bars represent SE of total height or diameter at planting and at the end of the first-year outplanting season. Bars marked with different capital letters differ statistically for total height (diameter) and different lower case letters differ statistically for increment according to Duncan’s test α = 0.05.
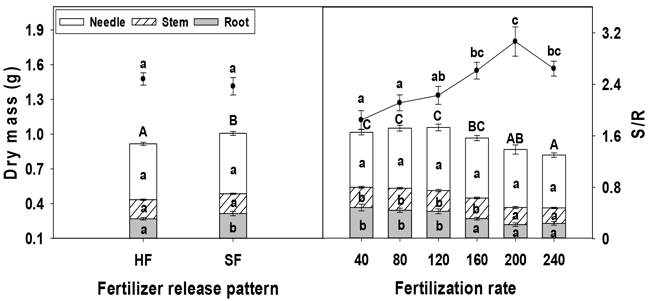
Fig. 2. Main effects of fertilizer release pattern (HF = Hi·End fertilizer; SF = Standard fertilizer) and fertilization rate (mg N
seedling–1) on dry mass (means ± SE; bars) and shoot/root ratio (S/R; dots) of Pinus tabulaeformis seedlings at outplanting. Bars marked with different capital letters differ statistically for whole plant dry mass and different lower-case letters differ statistically for each tissue dry mass according to Duncan’s test α = 0.05. Dots marked with different lower-case letters differ statistically for shoot/root ratio.
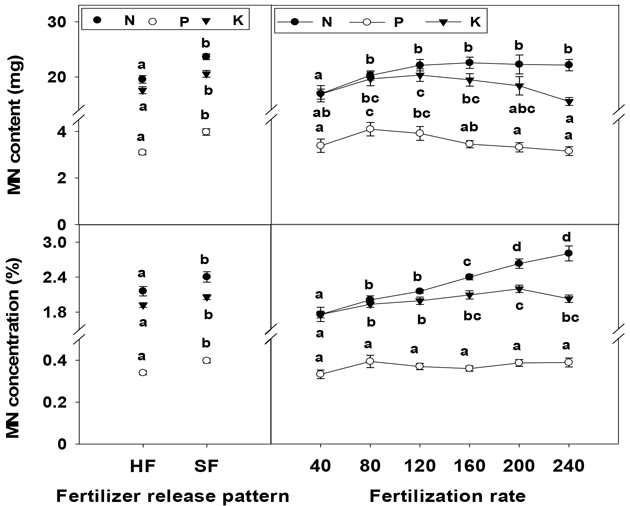
Fig. 3. Main effects of fertilizer release pattern (HF = Hi·End fertilizer; SF = Standard fertilizer) and fertilization rate (mg N
seedling–1) on mineral nutrient (MN) content and concentration of whole plant (means ± SE) of Pinus tabulaeformis seedlings at planting. Dots marked with different letters differ statistically according to Duncan’s test α = 0.05.
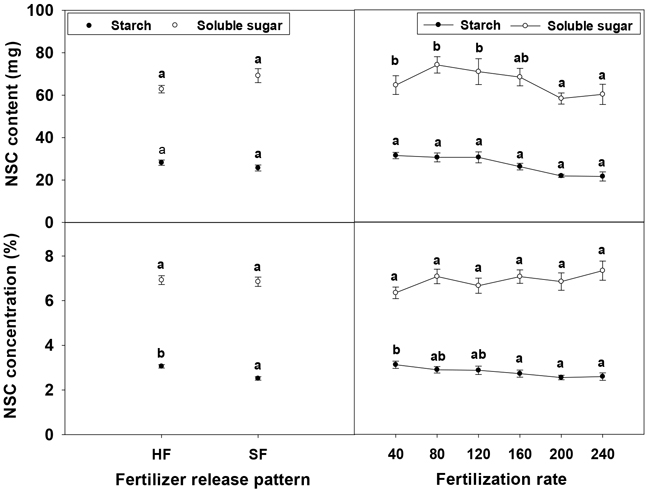
Fig. 4. Main effects of fertilizer release pattern (HF = Hi·End fertilizer; SF = Standard fertilizer) and fertilization rate (mg N
seedling–1) on non-structural carbohydrate (NSC) content and concentration for the whole plant (means ± SE) of Pinus tabulaeformis seedlings at planting. Bars marked with different letters differ statistically for starch and soluble sugars according to Duncan’s test α = 0.05, respectively.
| Table 1. Main effects of nursery fertilizer release pattern (HF = Hi·End fertilizer; SF = Standard fertilizer) and fertilization rate (mg N seedling–1) on Pinus tabulaeformis seedling survival (means ± SE) at the end of first growing season. Different letters differ statistically according to Duncan’s test α = 0.05 and separately to fertilizer release pattern and fertilization rate. | ||
| Level | Survival (%) | |
| Fertilizer release pattern | HF | 93 ± 1.85a |
| SF | 97 ± 1.15a | |
| Fertilization rate | 40 | 95 ± 2.67abc |
| 80 | 100 ± 0c | |
| 120 | 98 ± 1.64bc | |
| 160 | 98 ± 1.64bc | |
| 200 | 88 ± 3.66a | |
| 240 | 91 ± 2.95ab | |