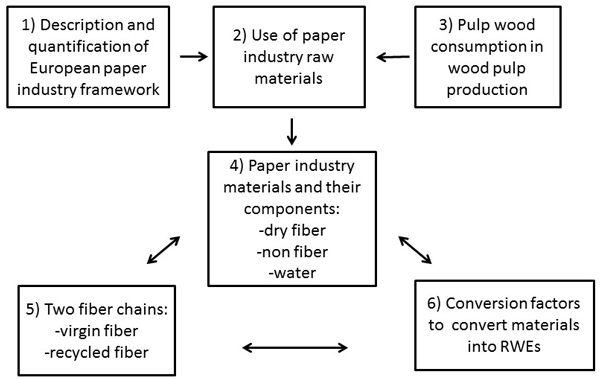
Fig. 1. Study structure – different steps of the study.
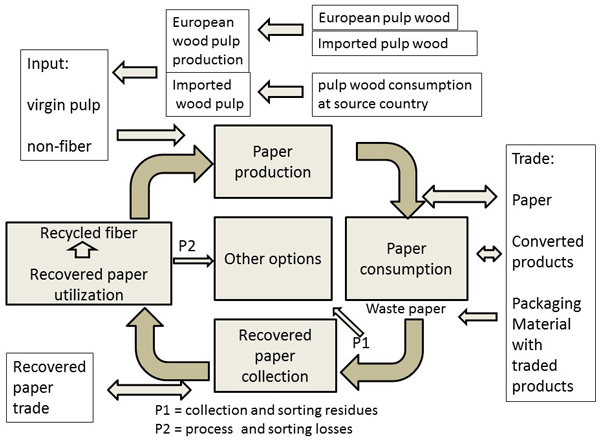
Fig. 2. Material framework for the paper industry, including the most important stages and material streams. The structure of the framework is based on a previous study by Ervasti and Kauranen (2011).
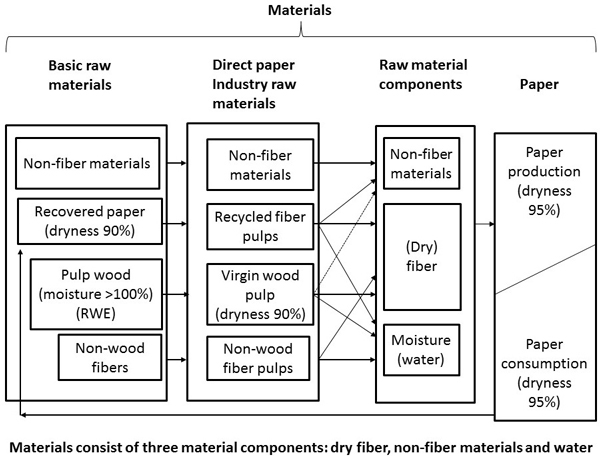
Fig. 3. Structure of the different material categories related to the paper industry material chain.
| Table 1. Corresponding values for two different moisture percentage calculation methods and the dryness percentage. | ||
| Moisture, % of dry wood (MCD) | Moisture, % of fresh (green) wood (MCG) | Dryness, % of fresh wood (DCG) |
| (9%) | (10%) | (90%) |
| (25%) | (20%) | (80%) |
| (43%) | (30%) | (70%) |
| (66%) | (40%) | (60%) |
| 100% | 50% | 50% |
| 150% | 60% | 40% |
| The two different water contents are interchangeable: MCG (%) = (MCD / (100 + MCD)) x 100 MCD (%) = (MCG / (100 – MCG)) x 100 Additionally, the dry material content (DCG) of fresh wood can be calculated as follows: DCG (%) = (100 – ((mass of water in wood) / (wet mass of wood))) x 100 Dryness values, which are more or less theoretical for fresh wood, in parenthesis | ||
| Table 2. List of countries belonging to the European Union (EU-27) and CEPI region in 2010. | |
| Europe (EU-27) | Austria, Belgium, Bulgaria, Cyprus, Czech Republic, Denmark, Estonia, Finland, France, Germany, Greece, Hungary, Ireland, Italy, Latvia, Lithuania, Luxembourg, Malta, The Netherlands, Poland, Portugal, Romania, Slovak Republic, Slovenia, Spain, Sweden, United Kingdom |
| CEPI region (19) | Austria, Belgium, Czech Republic, Finland, France, Germany, Hungary, Italy, The Netherlands, Norway, Poland, Portugal, Romania, Slovak Republic, Slovenia, Spain, Sweden, Switzerland, United Kingdom |
| Table 3. Detailed material table for the paper industry grade distribution of different raw materials used in the production of different paper grades. | |||
| Production of different paper grades | Different wood pulp grades used in paper production | Different recovered paper grades collected and utilized in paper production | Non-fiber materials used in paper production |
| - newsprint - printing and writing (other graphic) - tissue - packaging papers - other paper ∑ total paper | - total sulphate • bleached softwood • bleached hardwood • unbleached sulphate - mechanical and semichemical pulp - sulphite ∑ total wood pulp | - mixed grades - old corrugated containers - old news and magazines - high grades ∑ total recovered paper | ∑ total non-fiber materials |
| The symbol ∑ indicates that the value of the described material is the sum of the materials shown above. | |||
| Table 4. European (EU-27) paper production by grade and the consumption of different raw materials in the year 2010. | ||||||
| Paper grade (Million tons) | production of paper | consumption | ||||
| wood pulp 1) | recovered paper 2) | non-fiber material 3) | total raw material | % 4) | ||
| Newsprint | 9.0 | 2.3 | 8.3 | 0.1 | 10.7 | 119 |
| Printing and writing | 32.8 | 21.8 | 3.9 | 11.3 | 37.0 | 113 |
| Tissue | 6.8 | 4.3 | 3.3 | 0.2 | 7.8 | 115 |
| Corrugated board | 24.8 | 3.9 | 23.3 | 0.6 | 27.8 | 112 |
| Carton board | 9.7 | 5.5 | 4.4 | 1.1 | 11.0 | 113 |
| Other paper and board | 11.2 | 5.8 | 5.1 | 0.8 | 11.7 | 104 |
| Total paper and board | 94.2 | 43.6 | 48.3 | 14.0 | 106.0 | 113 |
| Source: Indufor 2013. 1) = total consumption of mechanical, semi-chemical and chemical wood pulps. 2) = total consumption of all recovered paper grades. 3) = including minerals and additives. 4) = % shows the ratio between total raw material consumption and paper production. | ||||||
| Table 5. Paper production and use of different wood pulps and recovered paper grades in EU-area in 2010. View in new window/tab. |
| Table 6. Consumption of wood in wood pulp production (comparison of different sources). | ||||||
| Pulp grade | One m3 (RWE) of wood, under bark, per one ton of pulp (90% dryness) produced | |||||
| FAO | SPIF | Pöyry | Koskinen | TT | Indufor | |
| Sulphate bleached | 4.55 | - | - | - | - | - |
| Sulphate, bleached softwood | - | - | 5.30 | - | 5.30 | 5.12 |
| Sulphate, bleached hardwood | - | - | 3.90 | - | 3.70 | 3.90 |
| Sulphate, unbleached | 4.45 | - | 4.90 | - | - | 4.72 |
| Sulphate unbleached softwood | - | - | 5.00 | - | ||
| Sulphate unbleached hardwood | - | - | 3.50 | - | ||
| Sulphite | - | 5.30 | - | - | 5.04 | |
| Sulphite, bleached | 4.95 | - | - | - | 4.80 | - |
| Sulphite, bleached softwood | - | 5.4–5.5 | - | 5.5–5.6 | - | - |
| Sulphite, bleached hardwood | - | 4.00 | - | 4.00 | - | - |
| Sulphite, unbleached | 4.64 | - | - | 4.50 | - | |
| Sulphite, unbleached softwood | 5.00 | 5.00 | - | - | ||
| Mechanical + semi-chemical | - | 2.50 | - | - | 2.48 | |
| Mechanical pulp | 2.50 | 2.6–2.8 | - | 2.50 | 2.40 | - |
| Semi-chemical pulp | 2.67 | 2.5–3.5 | - | 2.60 | 2.30 | - |
| Sources: FAO = FAO/UNECE 2010. SPIF = Sveriges Pappersindustriförebund 1969. Pöyry 2006. Koskinen 2000. TT = Tapion taskukirja 1976. Indufor 2013. | ||||||
| Table 7. Calculation of wood consumption for different wood pulp grades in Europe in 2010 (conversion factors for roundwood equivalents (RWE) per ton of wood pulp). | |||||
| Wood pulp grade | Wood pulp 1) consumption (mill. tons) /a | Wood pulp 1) production (mill. tons) /a | Conversion factor for 1 ton of pulp into 1 m3 (RWEs) 2) | Wood consumption for wood pulp consumption (million m3 RWEs) / a | Wood consumption for wood pulp production (million m3 RWEs) / a |
| Mechanical and semi-chemical pulp | 11.5 | 11.3 | 2.48 | 28.6 | 28.0 |
| Bleached softwood sulphate pulp | 10.7 | 9.7 | 5.12 | 54.8 | 49.5 |
| Bleached sulphate hardwood pulp | 14.7 | 9.1 | 3.90 | 57.4 | 35.6 |
| Unbleached sulphate pulp | 4.7 | 4.6 | 4.72 | 22.1 | 21.5 |
| Sulphite pulp | 2.0 | 2.0 | 5.04 | 10.0 | 10.0 |
| Total above | 43.6 | 36.6 | 3.97 5) | 173.0 4) | 143.0 3) |
| 1) Dryness 90%. 2) Source: Indufor 2013. 3) For reasons of consistency, the Indufor (2013) figure of 143 million RWEs is used. By using a conversion factor of 3.97, the figure would be 145.3 million RWEs. According to CEPI (2011), the amount of pulpwood consumed in the CEPI region is 147 million RWEs. However, the pulpwood consumption statistics for CEPI are based on a different country structure and a different definition of imported pulpwood. The value of the conversion factor changes annually depending on the volume shares of different imported wood pulps. 4) Europe is a net importer of wood pulp. A difference of 30 million RWEs (difference between wood pulp consumption and production) is consumed in wood pulp source countries. 5) Weighted average, which takes into account the consumption volumes of different wood pulps. Instead of 3.97 a rounded figure 4.0 is used in calculations. | |||||
| Table 8. Volumes of different paper industry materials and shares of the raw material components in Europe in 2010. | ||||
| Paper industry materials (million tons) | Total volume 1) | Dry wood fiber 2) component | Non-fiber component 3) | Water component |
| Paper production | 94.2 | 67.1 | 21.9 | 5.4 |
| Paper consumption | 81.4 | 58.3 | 18.3 | 4.7 |
| Paper net exports | 12.9 | 8.7 | 3.6 | 0.6 |
| Recovered paper collection | 56.2 | 38.3 | 12.3 | 5.6 |
| Recovered paper net exports | 7.9 | 5.5 | 1.6 | 0.8 |
| Recovered paper utilization | 48.3 | 32.8 | 10.7 | 4.8 |
| Wood pulp consumption | 43.6 | 39.3 | - | 4.3 |
| Source: Keränen and Ervasti 2014 1) dryness of paper is 95%, dryness of wood pulp and recovered paper is 90%. 2) (dry) wood fiber dryness is 100%. 3) the non-fiber component volume in paper production consists of added material and volumes which come together with recycled pulp. For example, the European recovered paper collection was 56.2 million tons in 2010. This volume consists of 38.3 million tons of (dry) fiber, 12.3 million tons of non-fiber components, and 5.6 million tons of water. | ||||
| Table 9. Key figures of the European paper industry material framework in the year 2010. Amounts of dry fiber and wood, expressed in RWEs are shown. | |||
| Material and material stage (Million tons and million RWEs per annum) | Total volume (million tons) | Dry wood fiber component in material 1) (million tons) | Wood in material (million RWEs) |
| Paper production, (CF) | 94.2 1), 1b) | 67.1 | 295 |
| - Wood pulp consumed in Europe | 43.6 | 39.3 | 173 |
| -- Wood pulp produced in Europe | 36.6 2a) | 143 | |
| --- Of which, amount wood imported from outside Europe 3), 4) | 30 | ||
| --- Of which, amount local wood sourced from Europe 5) | 113 | ||
| -- Net imports of wood pulp from outside Europe | 7 2a) | 30 | |
| - Recycled pulp produced in Europe (CF) | 36.5 1), 1b) | 27.8 | 122 |
| Paper net exports to places outside Europe (CF) | –12.9 1b), 2) | –8.7 | –38 |
| Paper consumption (CF) | 81.4 1b), 2) | 58.3 | 257 |
| European net trade of converted products and packages traded with goods | n.a. assumed: 0 3) | n.a. assumed: 0 | n.a. assumed: 0 |
| Paper not collected, and other options outside paper industry recycling (P1) (CF) | 28.8 1), 1b) | 20.1 | –89 |
| Recovered paper collection (CF) | 56.2 1b), 2a) | 38.3 | 168 |
| Recovered paper net exports (CF) | –7.9 1b), 2a) | –5.5 | –24 |
| Recovered paper utilized in recycled pulp production (CF) | 48.3 1b), 2a) | 32.8 | 144 |
| Of which, amount of process losses (P2) (CF) | 11.9 1), 1b) | 5.0 | –22 |
| 1) Keränen and Ervasti 2014. 1b) Material, including fiber, non-fiber, fillers and water components (mass balance). 2a) Indufor 2013; pulp grade structure of domestic and imported wood pulps vary. This affects the corresponding RWE volumes. 2b) Indufor 2013. 3) CEPI 2011. 4) Pulpwood imports refers to the CEPI pulpwood imports in 2010 (CEPI 2011) from outside the CEPI region. 5) According to CEPI (2011), the consumption of domestic pulpwood is 118 million m3 for the CEPI region. (CF) = a conversion factor of 4.4 is used to convert the dry fiber component of the material into RWEs. (P1 and P2) refer to material streams with respect to other options. n.a. = no available information. | |||
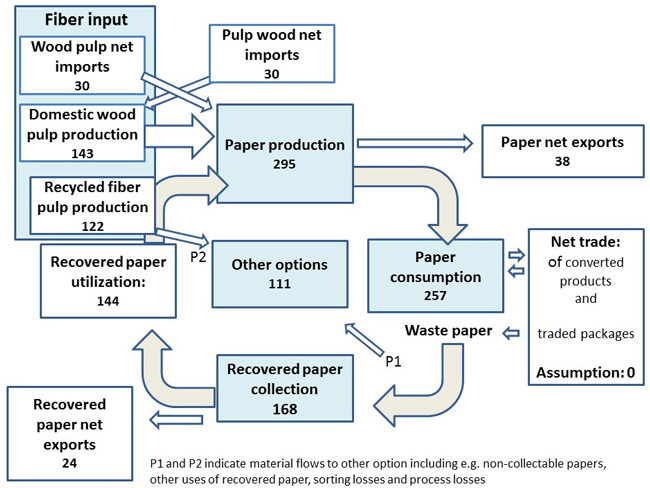
Fig. 4. The material framework for the European paper industry in 2010 and the wood material content of different materials expressed in millions of RWEs annually.