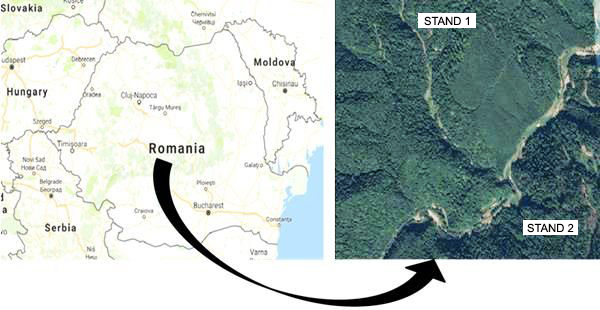
Fig. 1. Research venue.
| Table 1. Tree stand and marked tree characteristics. | |||||
| Tree stand characteristics | Marked tree characteristics | ||||
| Characteristic | Stand 1 | Stand 2 | Characteristic | Plot 1 | Plot 2 |
| Compartment area (ha) | 20.6 | 14.4 | Cutting area (ha) | 20.6 | 12.4 |
| Stand age (years) | 130 | 160 | Total volume (m3) | 1145 | 2376 |
| Breast height diameter (dbh) (cm) | 46 | 58 | No. of trees | 475 | 1063 |
| Average height (m) | 26 | 29 | Average tree volume (m3 tree–1) | 2.41 | 2.24 |
| Yield class | III | III | Dbh (cm) | 52 | 56 |
| Stand density (trees ha–1) | 302 | 164 | Average height (m) | 29.5 | 29 |
| Stand crown density (%) | 70 | 40 | Natural pruning (%) | 60 | 60 |
| Natural pruning (%) | 60 | 60 | Distance between marked trees (m) | 20.8 | 10.8 |
| Distance between trees (m) | 5.8 | 7.8 | - | - | - |
| Felling type | Open seeding felling | Intermediate felling | - | - | - |
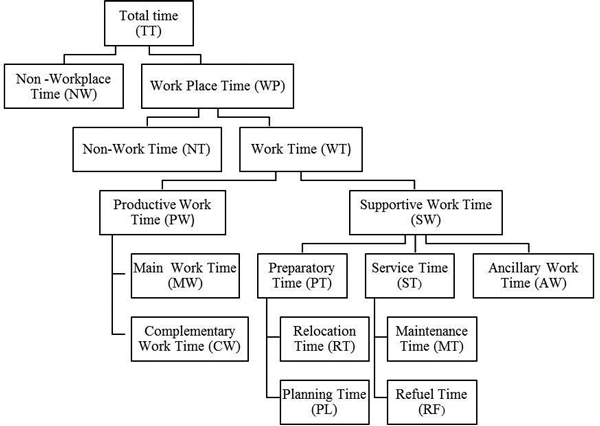
Fig. 2. Work time structure (adapted by Björheden and Thompson 2000).
| Table 2. Felling operation structure. | |||
| Stage | Symbol | Start | End |
| Moving to the felled tree | depl | when the feller starts moving toward the tree to be cut | when the feller reaches the tree |
| Preparing the workplace | plm | when the feller starts clearing around the tree | when the feller ends the preparation of the workplace |
| Choosing the felling direction and preparing the escape route | add | when the feller starts judging where the tree will fall | when the feller prepared the escape route |
| Sink cutting | et | when the feller starts cutting the sink | when the feller extracted the sink |
| Back-cutting | etpot | when the feller starts cutting in the opposite direction | when the tree starts to fall |
| Fellers’ retreat, tree hitting the ground and fellers’ return | rm | when the tree starts to fall and the feller retreats on the escape route | when the tree hits the ground and the feller returns near the stump |
| Wood fibre cutting off the stump | nc | when the feller starts to cut off the stump the wood fibre split from hinge wood | when the feller finished cutting the wood fibre off the stump |
| Wood fibre cutting off the stem | tct | when the feller starts to cut off the stem the wood fibre split from hinge wood | when the feller finished cutting the wood fibre off the stem |
| Stump debarking | cc | when the assistant starts the stump debarking with an axe | when the assistant finished the stump debarking |
| Table 3. Work time structure according to stages and activities. | ||||||||
| Work time structure | Operations | Stages | Activities | |||||
| TT | NW | Felling | - | Moving to and from the workplace at the beginning and ending of the schedule | ||||
| WP | NT | Felling | - | Meal, rest, needs, moving from one group of trees to another, organization | ||||
| WT | PW | MW | Felling | et etpot | Sink cutting and extraction Back cutting and wedging | |||
| CW | Felling | plm add rm | Removing obstacles from around the tree and butt trimming Analysing factors involved in choosing the felling direction and establishing the felling direction Fellers’ retreat, tree hitting the ground and fellers’ return | |||||
| SW | PT | RT | Felling | depl | Moving from one tree to the next | |||
| ST | MT | Felling | - | Saw chain sharpening and chain tension Saw chain replacement and guide bar turning Cleaning the air filter | ||||
| RF | Felling | - | Chainsaw fuelling with mixed fuel and oil for chain lubrication | |||||
| AW | Felling | nc tct cc | Wood fibre cutting off the stump and stem Stump debarking with an axe | |||||
| Work time structure: TT – total time; NW – non-workplace time; WP – workplace time; NT – non-work time; WT – work time; PW – productive work time; SW – supportive work time; MW – main work time; CW – complementary work time; PT – preparatory time; ST – service time; AW – ancillary work time; RT – relocation time; PL – planning time; MT – maintenance time; RF – refuel time. | ||||||||
| Table 4. Minimum number of measurements. | ||||||
| Operation | Venue | Size of sample lot | Parameter values (%) | Number of measurements | ||
| p | q | calculated | made | |||
| Felling | Felling area | 50 | 52 | 48 | 96 | 491 |
| p – the percentage of unproductive time; q – the percentage of active time. | ||||||
| Table 5. Worktime structure in felling operations. | ||||||||||||
| Plots | No. of trees | Volume | Workplace time (WP) | Non-workplace time (NW) | Total time (TT) | |||||||
| Productive work time (PW) | Supportive work time (SW) | Non-work time (NT) | ||||||||||
| m3 | s m–3 | % | s m–3 | % | s m–3 | % | s m–3 | % | s m–3 | % | ||
| S1 | 241 | 537.528 | 69.55 | 19.59 | 120.30 | 33.88 | 124.78 | 35.14 | 40.48 | 11.39 | 355.11 | 100 |
| s tree–1 | s tree–1 | s tree–1 | s tree–1 | s tree–1 | ||||||||
| 155.12 | 268.32 | 278.31 | 90.29 | 792.03 | ||||||||
| S2 | 250 | 655.981 | 55.92 | 17.66 | 97.25 | 30.73 | 111.98 | 35.38 | 51.35 | 16.23 | 316.50 | 100 |
| s tree–1 | s tree–1 | s tree–1 | s tree–1 | s tree–1 | ||||||||
| 146.72 | 255.19 | 293.82 | 134.75 | 830.48 | ||||||||
| WP – workplace time; PW – productive work time; SW – supportive work time; NT – non-work time; NW – non-workplace time; TT – total time. | ||||||||||||
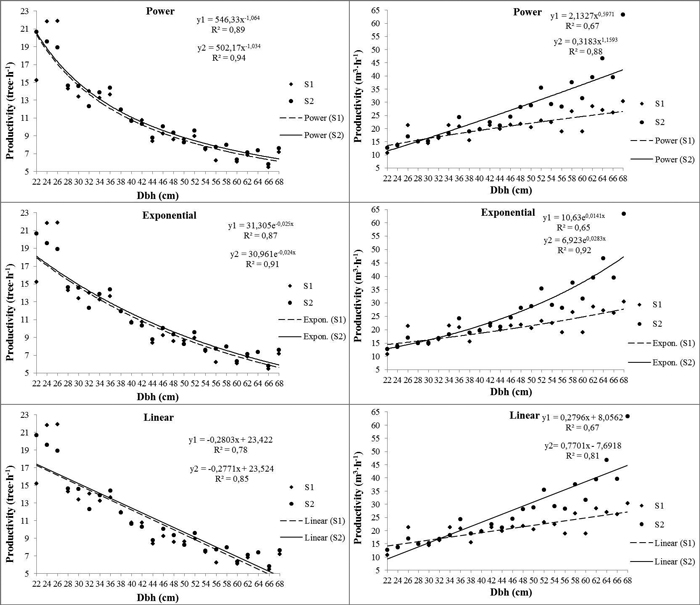
Fig. 3. Felling productivity for different tree diameters at the breast height (dbh) (without delay). View larger in new window/tab.
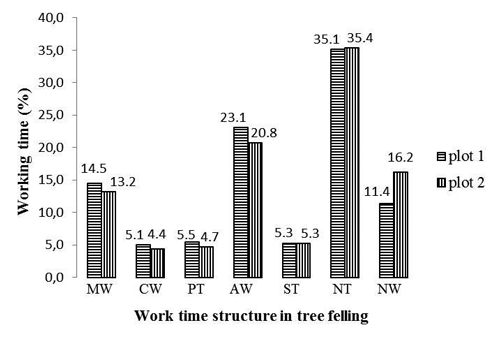
Fig. 4. Work time structure in tree felling: MW – main work time; CW – complementary work time; PT – preparatory time; AW – ancillary work time; ST – service time; NT – non-work time; NW – non-workplace time.
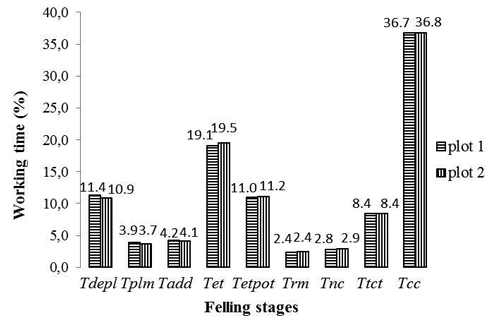
Fig. 5. Time consumption in tree felling: Tdepl – work time corresponding to depl stage; Tplm – work time corresponding to plm stage; Tadd – work time corresponding to add stage; Tet – work time corresponding to et stage; Tetpot – work time corresponding to etpot stage; Trm – work time corresponding to rm stage; Tnc – work time corresponding to nc stage; Ttct – work time corresponding to tct stage; Tcc – work time corresponding to cc stage.
| Table 6. Statistical indicators of work time variation corresponding to stages in the felling of one m3 of wood and to operational variables measured in felling areas. | ||||||||||
| Descriptive statistics | Mean | Median | Standard Error | Standard Deviation | Variation Coefficient (%) | |||||
| plot 1 | plot 2 | plot 1 | plot 2 | plot 1 | plot 2 | plot 1 | plot 2 | plot 1 | plot 2 | |
| Descriptive statistics of work time (s m–3) according to each stage of felling | ||||||||||
| Tdepl | 19.94 | 17.66 | 19.72 | 15.51 | 1.11 | 1.80 | 5.85 | 10.35 | 29.33 | 58.62 |
| Tplm | 7.16 | 6.83 | 7.39 | 3.40 | 1.02 | 1.27 | 5.39 | 7.30 | 75.27 | 106.9 |
| Tadd | 7.39 | 6.55 | 7.02 | 5.95 | 0.45 | 0.75 | 2.36 | 4.32 | 32.92 | 66.01 |
| Tet | 33.16 | 29.95 | 33.41 | 27.36 | 1.14 | 2.01 | 6.06 | 11.55 | 18.26 | 38.56 |
| Tetpot | 19.15 | 16.76 | 18.91 | 14.71 | 0.64 | 0.95 | 3.41 | 5.44 | 17.81 | 32.44 |
| Trm | 4.11 | 4.11 | 4.10 | 3.92 | 0.19 | 0.41 | 0.99 | 2.33 | 24.16 | 56.65 |
| Tnc | 4.86 | 4.57 | 4.62 | 4.31 | 0.26 | 0.36 | 1.38 | 2.08 | 28.34 | 45.55 |
| Ttct | 14.46 | 13.36 | 13.67 | 13.55 | 0.77 | 1.26 | 4.09 | 7.26 | 28.29 | 54.33 |
| Tcc | 64.55 | 58.84 | 61.16 | 58.55 | 2.28 | 4.00 | 12.06 | 22.98 | 18.68 | 39.06 |
| Teff | 174.78 | 158.63 | 174.76 | 163.08 | 6.31 | 11.06 | 33.37 | 63.53 | 19.09 | 40.05 |
| Descriptive statistics of dbh, sd (cm), d (m) and V (m3) | ||||||||||
| dbh | 44.6 | 43.6 | 44.0 | 44.0 | 0.66 | 0.67 | 10.18 | 10.56 | 22.80 | 24.20 |
| sd | 53.7 | 52.7 | 54.5 | 53.0 | 0.82 | 0.82 | 12.68 | 12.95 | 23.63 | 24.56 |
| d | 20.9 | 10.5 | 16.0 | 8.0 | 1.12 | 0.59 | 17.31 | 9.32 | 8.29 | 8.87 |
| V | 2.230 | 2.624 | 2.005 | 2.313 | 0.07 | 0.10 | 1.048 | 1.57 | 46.99 | 9.78 |
| Tdepl – work time corresponding to depl stage; Tplm – work time corresponding to plm stage; Tadd – work time corresponding to add stage; Tet – work time corresponding to et stage; Tetpot – work time corresponding to etpot stage; Trm – work time corresponding to rm stage; Tnc – work time corresponding to nc stage; Ttct – work time corresponding to tct stage; Tcc – work time corresponding to cc stage; Teff – actual work time corresponding to a complete succession of stages in tree felling; d – distance between harvested trees; sd – stump diameter; V – tree volume. | ||||||||||
| Table 7. Simple linear regression analysis of Tdepl in relation to d. | ||||||||
| ANOVA | Significance of variable coefficient | |||||||
| R2 | Standard Error | Degrees of freedom | F | Variable | Coefficient | Standard Error | t Statistic | P-value |
| Simple linear regression analysis of Tdepl in relation to d | ||||||||
| Plot 1 | ||||||||
| 0.77 | 15.629 | Regression 1 Residual 239 | 779.313*** | Constant | 9.362 | 1.579 | 5.930 | < 0.001*** |
| d | 1.630 | 0.058 | 27.916 | < 0.001*** | ||||
| Plot 2 | ||||||||
| 0.78 | 14.663 | Regression 1 Residual 248 | 894.867*** | Constant | 7.527 | 1.401 | 5.372 | < 0.001*** |
| d | 2.970 | 0.099 | 29.914 | < 0.001*** | ||||
| Asterisks denote F significance and significant correlations, *** P-value < 0.001; Tdepl – work time corresponding to depl stage; d – distance between harvested trees. | ||||||||
| Table 8. Simple linear regression analysis of Tet and Tetpot in relation to sd and dbh. | ||||||||
| ANOVA | Significance of variable coefficient | |||||||
| R2 | Standard Error | Degrees of freedom | F | Variable | Coefficient | Standard Error | t Statistic | P-value |
| Simple linear regression analysis of Tet in relation to sd | ||||||||
| Plot 1 | ||||||||
| 0.49 | 26.665 | Regression 1 Residual 239 | 234.216*** | Constant | –38.433 | 7.476 | –5.141 | < 0.001*** |
| sd | 2.072 | 0.135 | 15.304 | < 0.001*** | ||||
| Plot 2 | ||||||||
| 0.42 | 28.964 | Regression 1 Residual 248 | 182.171*** | Constant | –31.017 | 7.705 | –4.026 | < 0.001*** |
| sd | 1.917 | 0.142 | 13.497 | < 0.001*** | ||||
| Simple linear regression analysis of Tet in relation to dbh | ||||||||
| Plot 1 | ||||||||
| 0.47 | 27.349 | Regression 1 Residual 239 | 210.854*** | Constant | –39.666 | 7.951 | –4.989 | < 0.001*** |
| dbh | 2.520 | 0.174 | 14.521 | < 0.001*** | ||||
| Plot 2 | ||||||||
| 0.40 | 29.614 | Regression 1 Residual 248 | 163.506*** | Constant | –29.343 | 7.991 | –3.672 | < 0.001*** |
| dbh | 2.277 | 0.178 | 12.787 | < 0.001*** | ||||
| Simple linear regression analysis of Tetpot in relation to sd | ||||||||
| Plot 1 | ||||||||
| 0.47 | 15.112 | Regression 1 Residual 239 | 206.574*** | Constant | –17.184 | 4.237 | –4.056 | < 0.001*** |
| sd | 1.103 | 0.077 | 14.373 | < 0.001*** | ||||
| Plot 2 | ||||||||
| 0.38 | 16.543 | Regression 1 Residual 248 | 151.244*** | Constant | –12.618 | 4.401 | –2.867 | < 0.001*** |
| sd | 0.998 | 0.081 | 12.298 | < 0.001*** | ||||
| Simple linear regression analysis of Tetpot in relation to dbh | ||||||||
| Plot 1 | ||||||||
| 0.43 | 15.625 | Regression 1 Residual 239 | 177.786*** | Constant | –16.982 | 4.542 | –3.739 | < 0.001*** |
| dbh | 1.322 | 0.099 | 13.334 | < 0.001*** | ||||
| Plot 2 | ||||||||
| 0.35 | 16.912 | Regression 1 Residual 248 | 134.008*** | Constant | –11.408 | 4.564 | –2.500 | < 0.001*** |
| dbh | 1.177 | 0.102 | 11.576 | < 0.001*** | ||||
| Asterisks denote F significance and significant correlations, *** P-value < 0.001; Tet – work time corresponding to et stage; Tetpot – work time corresponding to etpot stage; sd – stump diameter; dbh – breast height diameter. | ||||||||
| Table 9. Simple linear regression analysis of Tnc in relation to sd and dbh. | ||||||||
| ANOVA | Significance of variable coefficient | |||||||
| R2 | Standard Error | Degrees of freedom | F | Variable | Coefficient | Standard Error | t Statistic | P-value |
| Simple linear regression analysis of Tnc in relation to sd | ||||||||
| Plot 1 | ||||||||
| 0.24 | 5.593 | Regression 1 Residual 239 | 74.898*** | Constant | –4.870 | 1.849 | –2.634 | 0.009** |
| sd | 0.290 | 0.033 | 8.654 | < 0.001*** | ||||
| Plot 2 | ||||||||
| 0.21 | 6.503 | Regression 1 Residual 248 | 65.385*** | Constant | –3.180 | 1.730 | –1.838 | 0.067 |
| sd | 0.258 | 0.032 | 8.086 | < 0.001*** | ||||
| Simple linear regression analysis of Tnc in relation to dbh | ||||||||
| Plot 1 | ||||||||
| 0.18 | 6.821 | Regression 1 Residual 239 | 54.356*** | Constant | –3.555 | 1.983 | –1.793 | 0.074 |
| dbh | 0.319 | 0.043 | 7.373 | < 0.001*** | ||||
| Plot 2 | ||||||||
| 0.16 | 6.712 | Regression 1 Residual 248 | 46.223*** | Constant | –1.563 | 1.811 | –0.863 | 0.388 |
| dbh | 0.274 | 0.040 | 6.799 | < 0.001*** | ||||
| Asterisks denote F significance and significant correlations, *** P-value < 0.001; Tnc – work time corresponding to nc stage; sd – stump diameter; dbh – breast height diameter. | ||||||||
| Table 10. Simple linear regression analysis of Tcc in relation to sd and dbh. | ||||||||
| ANOVA | Significance of variable coefficient | |||||||
| R2 | Standard Error | Degrees of freedom | F | Variable | Coefficient | Standard Error | t Statistic | P-value |
| Simple linear regression analysis of Tcc in relation to sd | ||||||||
| Plot 1 | ||||||||
| 0.50 | 35.323 | Regression 1 Residual 239 | 237.089*** | Constant | –14.057 | 10.269 | –1.369 | < 0.001*** |
| sd | 3.452 | 0.224 | 15.398 | < 0.001*** | ||||
| Plot 2 | ||||||||
| 0.44 | 38.100 | Regression 1 Residual 248 | 197.969*** | Constant | –8.728 | 10.282 | –0.849 | < 0.001*** |
| sd | 3.223 | 0.229 | 14.070 | < 0.001*** | ||||
| Simple linear regression analysis of Tcc in relation to dbh | ||||||||
| Plot 1 | ||||||||
| 0.47 | 36.399 | Regression 1 Residual 239 | 209.360*** | Constant | –3.572 | 10.205 | –0.350 | < 0.001*** |
| dbh | 2.674 | 0.185 | 14.469 | < 0.001*** | ||||
| Plot 2 | ||||||||
| 0.43 | 38.529 | Regression 1 Residual 248 | 188.092*** | Constant | –4.634 | 10.250 | –0.452 | < 0.001*** |
| dbh | 2.591 | 0.189 | 13.715 | < 0.001*** | ||||
| Asterisks denote F significance and significant correlations, *** P-value < 0.001; Tcc – work time corresponding to cc stage; sd – stump diameter; dbh – breast height diameter. | ||||||||
| Table 11. Multiple linear regression analysis of Teff in relation to sd and d. | ||||||||
| ANOVA | Significance of variable coefficient | |||||||
| R2 | Standard Error | Degrees of freedom | F | Variable | Coefficient | Standard Error | t Statistic | P-value |
| Simple linear regression analysis of Teff in relation to sd and d | ||||||||
| Plot 1 | ||||||||
| 0.65 | 86.320 | Regression 1 Residual 239 | 218.149*** | Constant | –77.353 | 24.486 | –3.159 | 0.002** |
| sd | 7.146 | 0.442 | 16.169 | < 0.001*** | ||||
| d | 3.590 | 0.325 | 11.043 | < 0.001*** | ||||
| Plot 2 | ||||||||
| 0.58 | 97.215 | Regression 1 Residual 248 | 170.368*** | Constant | –48.664 | 26.036 | –1.869 | 0.062 |
| sd | 6.258 | 0.483 | 12.959 | < 0.001*** | ||||
| d | 7.277 | 0.667 | 10.917 | < 0.001*** | ||||
| Asterisks denote F significance and significant correlations, *** P-value < 0.001; Teff – actual work time corresponding to a complete succession of stages in tree felling; d – distance between harvested trees; sd – stump diameter. | ||||||||